The August 4 Commitments of Traders report, released Friday by the CFTC, carries an awkward but instructive flaw: its snapshot predates the two biggest catalysts of the week — Friday's job-loss payrolls print and Monday's near-5% crude spike as the Strait of Hormuz talks stalled. Read as a live signal, it is already stale.
Read correctly — as a map of where positioning stood before those shocks — it explains a great deal about how oil, gold and silver have traded since, and it flags three completely different setups hiding under the single macro roof of the Iran conflict.
The thread running through all three: the net-long headline tells you far less than the quality of the change beneath it.
Crude: The Decks Were Cleared Right Before the Squeeze
Managed-money and speculative accounts cut WTI net length to roughly 101,824 contracts, down about 4,683 on the week (NYMEX WTI Managed Money futures & options) — an extension of the war-premium unwind that began when Hormuz-reopening optimism cracked oil more than 7% the week before.
Crucially, longs were bailing into the low. The snapshot closed Tuesday; by Friday the labor data landed, and by Monday crude ripped almost 5% as the Oman track stalled.
Lighter net length going into that rebound is exactly what a squeeze needs — fewer offside longs to shake out, more sidelined money free to chase. Anyone fading Monday's rally on the logic that “specs are still long” was trading a number the tape had already overtaken.
The takeaway: washed-out positioning into a live supply-risk market is asymmetry, not confirmation of weakness.
Oil (CL) Four-Hour Chart, August 11, 2026
Source: TradingView
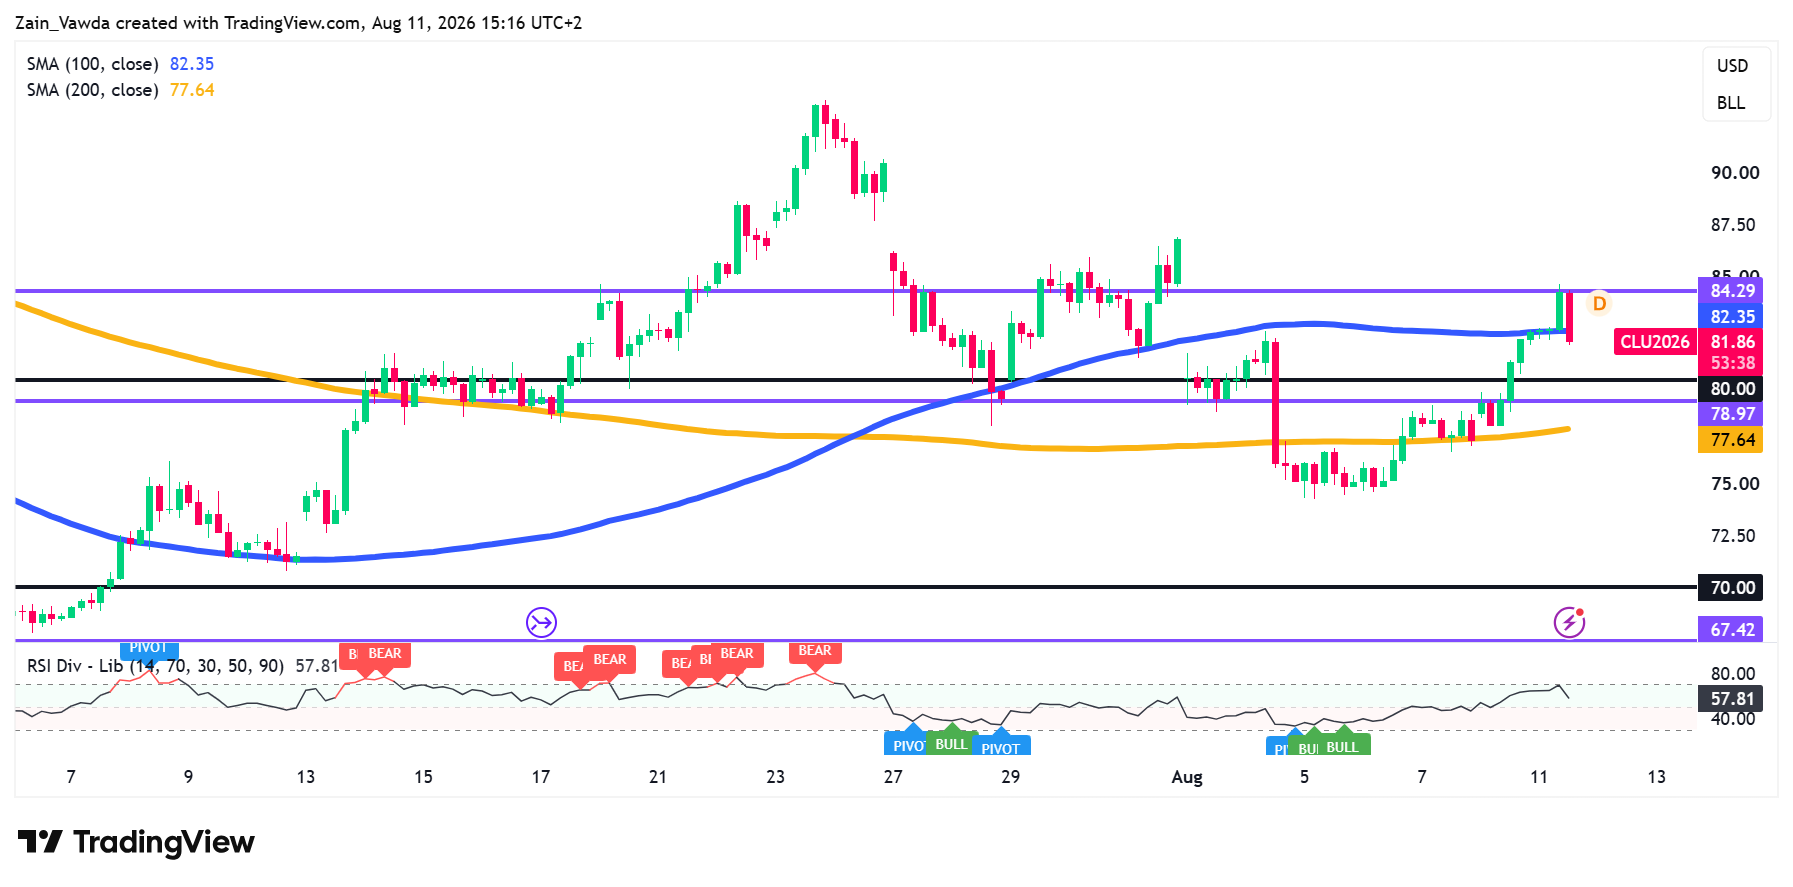
CL (Sep, H4) has ripped off the early-August $75 base, reclaiming the 200-MA (77.64) and the psychological $80 handle to spike into 84.29 resistance before fading to 81.86.
Price is now wrestling the 100-MA at 82.35 — the pivot for follow-through.
RSI at 57.81 is constructive but not overbought, with no bearish divergence on the latest leg.
Holding above $80 keeps the squeeze intact; a close back below flips 78.97/77.64 into the downside test.
Gold: A Crowded Long That's Maturing, Not Building
Managed money sat net long about 130,766 contracts, and funds did add fresh longs on the week — but total open interest fell by roughly 13,052 contracts. That combination matters.
When new buyers step in while the overall market is shrinking, it shows a trade that is getting crowded and mature, rather than one just beginning a new leg up.
Nobody is panicking or dumping gold right now, which is positive. However, because the trade is so crowded, a hotter-than-expected inflation report (CPI) could trigger a sudden jump in the US dollar or bond yields. That would force lots of buyers to sell at the same time into a shrinking market
The takeaway: Gold looks ready to defend its current high prices, but it isn't set up for a big new breakout right now.
Gold (GC) Four-Hour Chart, August 11, 2026
Source: TradingView
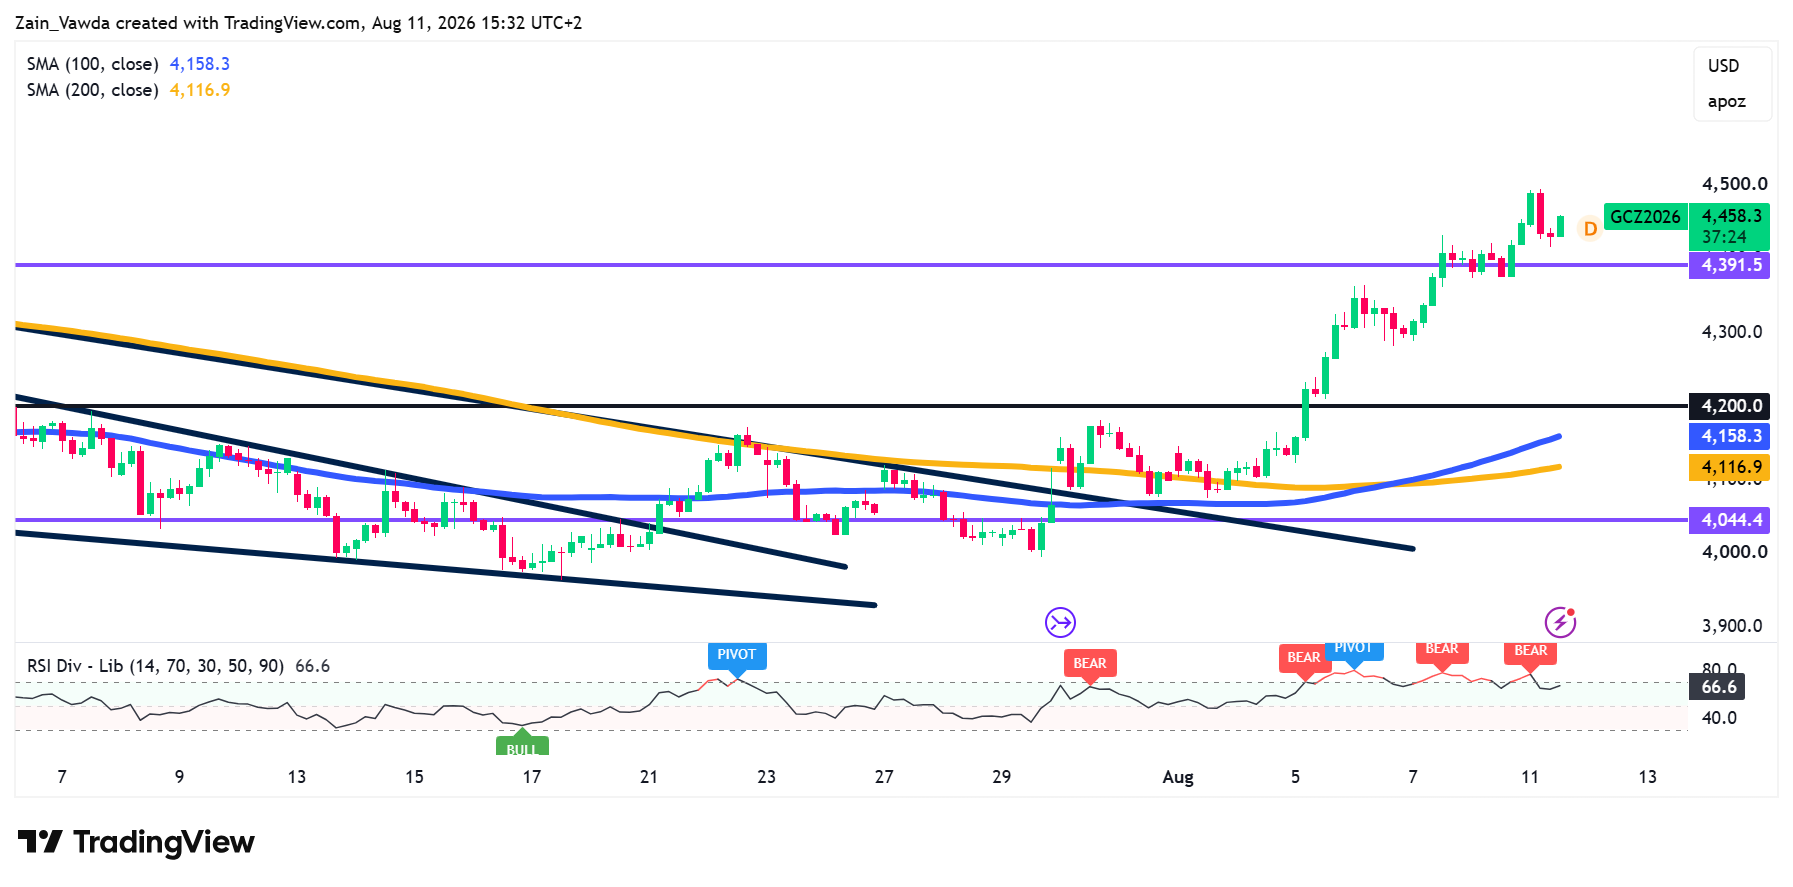
GC has gone near-vertical this week, exploding off the ~$4,044 base through the $4,200 shelf and $4,391.5 to tag fresh highs just shy of $4,500 before settling at 4,458.3.
Both MAs (100 at 4,158; 200 at 4,117) have curled up beneath price — a clean bullish stack. RSI at 66.6 is strong but flashing bearish divergence on the latest push, hinting the vertical leg needs to digest. $4,391.5 is now the pivot; holding it keeps the breakout intact.
Silver: The Cleanest Flow of the Three
Investment funds increased their net bullish bets on silver by 2,792 contracts, bringing their total to around 11,974.
Almost all of the new positions came from buyers opening brand-new bullish trades (+2,526) rather than short-sellers just closing out losing trades (+266). At the same time, the total number of active contracts in the market grew by 5,280. New money entering a growing market shows genuine belief in silver, not a short-lived price spike.
The only warning sign is how fast this buying happened—pushing short-term activity near 6-month highs (85th percentile). However, looking at a full 1-year window, buying levels are still pretty average (48th percentile) and actually lower than they were a month ago.
Silver might be a bit heated in the short term, but it has plenty of headroom to keep climbing over the bigger picture. Out of crude oil, gold, and silver, silver has the strongest and healthiest market backing.
Silver (SI) Four-Hour Chart, August 11, 2026
Source: TradingView
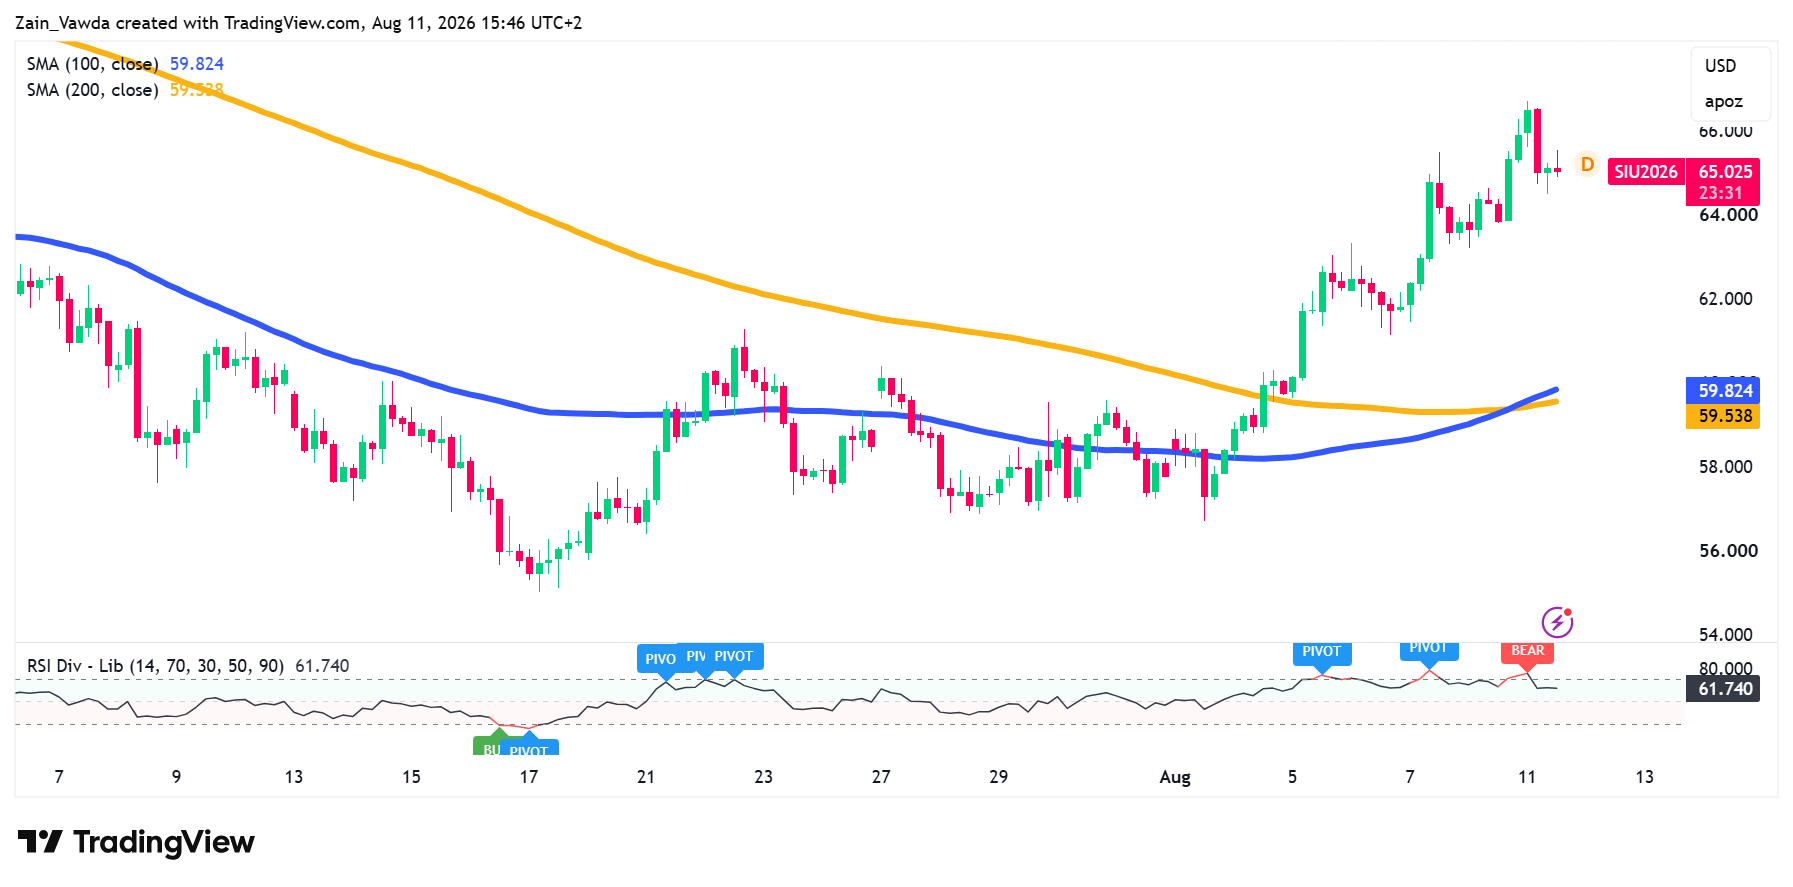
SI (Sep, H4) extended its run this week, tagging fresh highs near $66 before a sharp rejection candle pulled it back to 65.025. The 100/200-SMAs (59.82/59.54) have finally curled up and converged far below — a bullish base, but price is stretched well above them. RSI at 61.74 has cooled off overbought and is printing bearish divergence into the high, echoing gold.
Momentum's intact above $64; that rejection wick is the near-term caution flag to watch for follow-through.
Trader positioning data provides clear visibility into overall market sentiment. By highlighting where capital is allocated, it helps traders spot overcrowded positions, identify powerful contrarian signals, and better time market entries while managing risk more effectively.
Take a look at the latest data using the Positioning Edge Tool on the MarketFramework website to improve your edge.


