Gold is struggling on Monday, with a retest of $4,000 an ounce growing more likely after a brutal end to last week.
The metal shed more than 4% across the back half of last week, including a near-3% drop on Friday and slipped to an eight-day low near $4,400 early today before clawing back some ground.
In plain terms: the strong August run has stalled, and gold is now hunting for a floor rather than pushing for new highs. With today being month-end, some of the steadier tone is simply position-squaring into the close of a still-positive month.
What Knocked Gold Lower
Two things turned the tape.
First, new Fed Chair Kevin Warsh sounded surprisingly hawkish at Jackson Hole on Friday, warning that inflation is not slowing enough and that the Fed still has “work to do.” That lifted the market-implied odds of a September rate hike to around 60%, from roughly 35% a day earlier.
Second, the U.S. struck Iranian targets near the Strait of Hormuz over the weekend, which also adds to concerns around oil prices and inflation. Morgan Stanley recently lifted its fourth-quarter 2026 oil price forecast to $100 per barrel for Brent crude and $96 per barrel for WTI
Today’s one small help is that the dollar is easing back a little on profit-taking after Friday’s jump which is why gold is just above water rather than falling further.
The Bigger Risk: A Very Crowded Long
Underneath the price sits a positioning risk worth naming. Futures data through 25 August shows large speculators are heavily one-directional, net long by the most in almost eight years.
Looking at the data, the crowd holds close to 57% of the whole market on the long side, just shy of an all-time record. A crowded long is dangerous because if price breaks lower, those traders head for the exit together, which can turn a routine dip into a fast fall.
The argument by some analysts is that the unwind is not finished and $4,280 as a downside target into the September Fed meeting is a possibility, unless gold can reclaim $4,560.
What the Charts Say (H4 and H1)
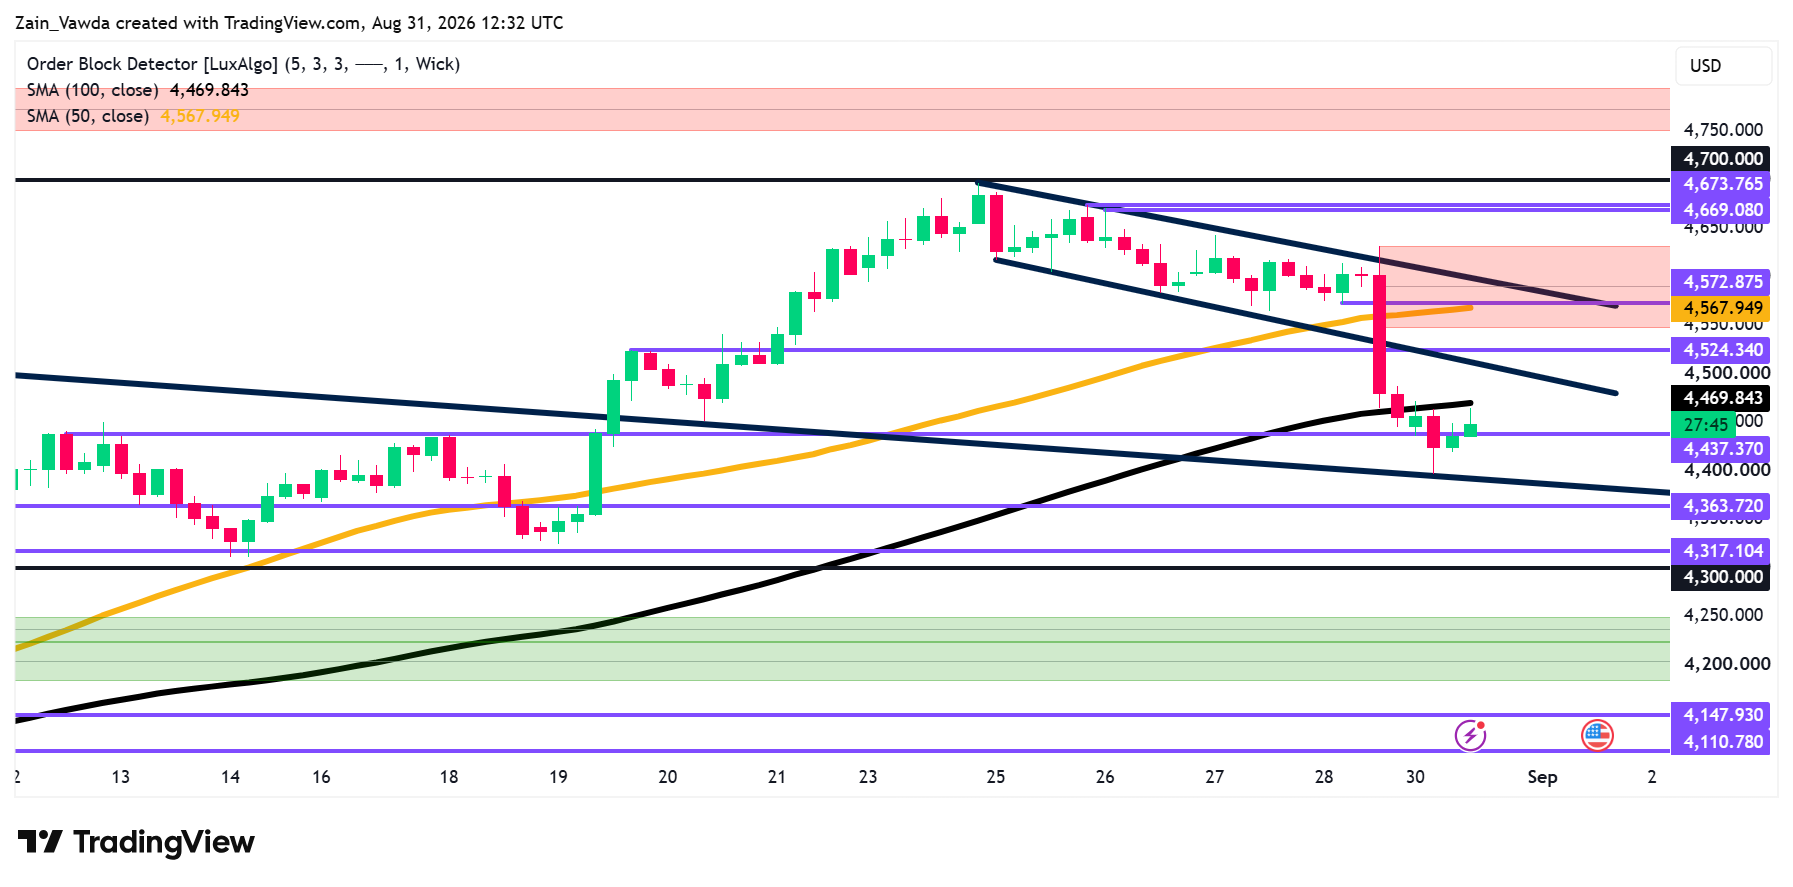
Gold price sits below the 50 and 100 MAs at present, the trend is leaning down.
The shaded “order block” zones mark areas where big players traded heavily before, which tend to act as support or resistance later.
On the 4-hour chart, gold climbed to about $4,690 in late August, then broke down hard out of its rising channel on the Warsh-and-Iran one-two punch, and has now failed at its 100-period average near $4,470.
Gold (XAU/USD) Four-Hour Chart, August 31, 2026
Source: TradingView
Overhead, the 50-period average around $4,568 lines up almost exactly with the $4,573 level and a red bearish order block, a thick wall of resistance, and the very $4,560 line the positioning call hinges on.
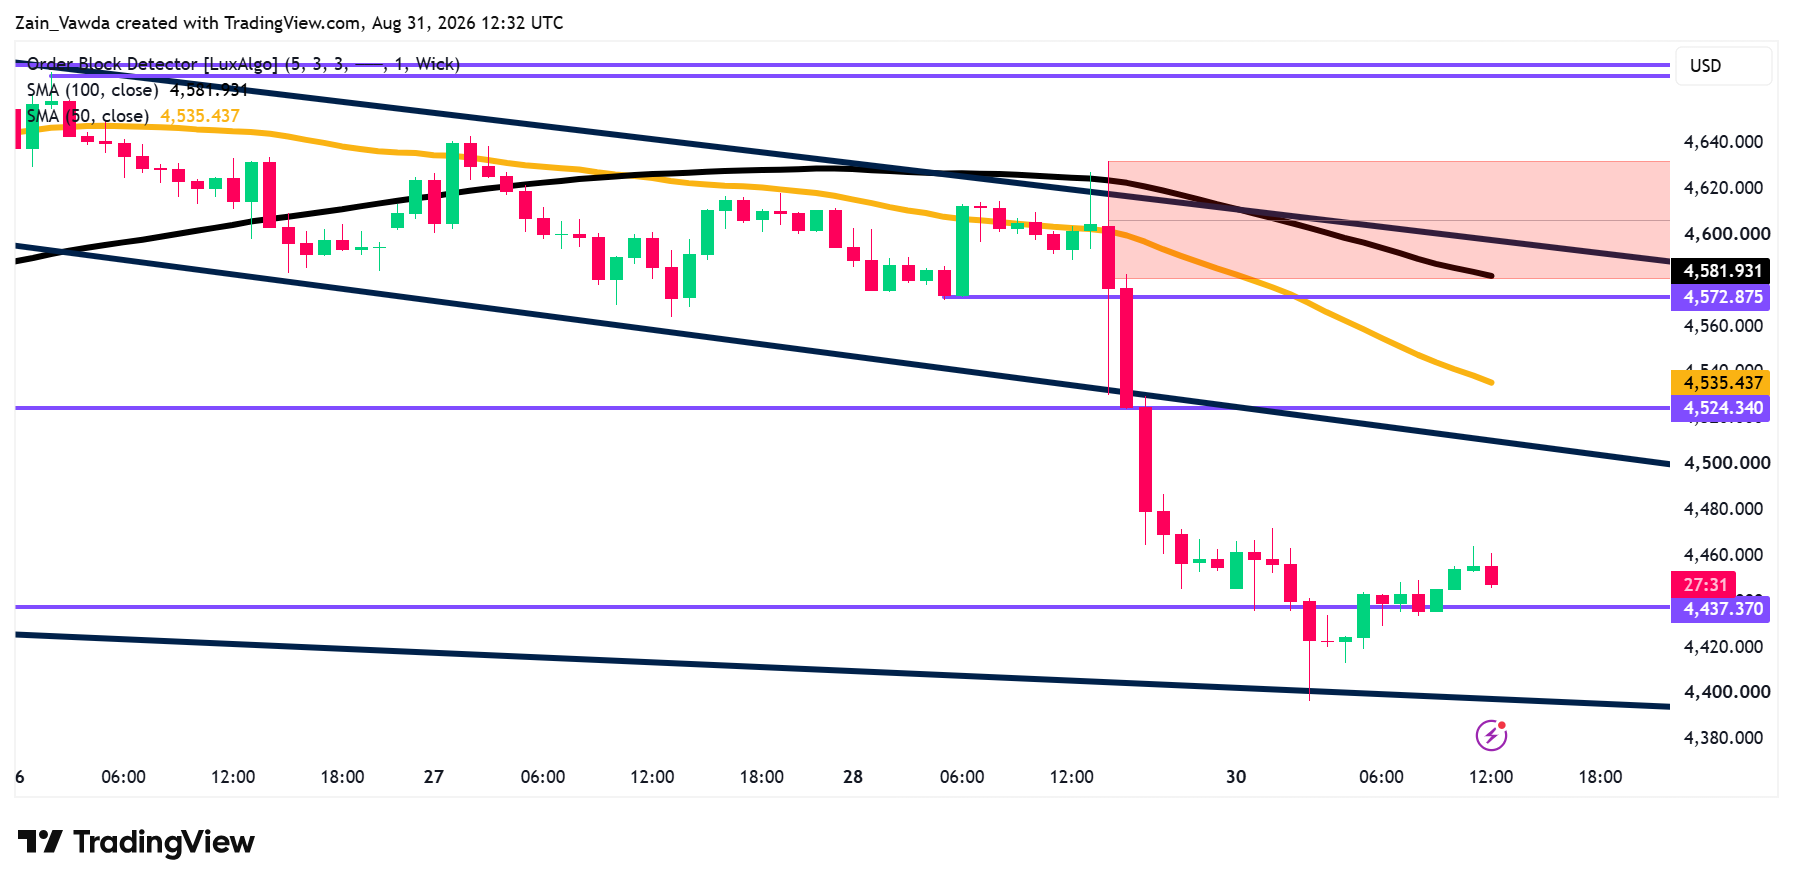
Gold (XAU/USD) One-Hour Chart, August 31, 2026
Source: TradingView
On the 1-hour chart, the short-term trend is clearly down: price is below both its 50- and 100-period averages (roughly $4,535 and $4,582).
Gold has bounced off firm support at $4,400, but every average and level above it now acts as a ceiling.
The Next 24 Hours
The near-term driver is the US dollar, with this being the first day of a jobs-heavy week (ADP mid-week, Nonfarm Payrolls the main event). Until that data lands, gold is likely to trade off the dollar and month-end flows between its floor and the wall above.
Potential Scenario Matrix
| Scenario | What Sets It Off( Next 24 Hours) | The Path |
|---|---|---|
| Bull | The near-term driver is the US dollar, with this being the first day of a jobs-heavy week (ADP mid-week, Nonfarm Payrolls the main event). Until that data lands, gold is likely to trade off the dollar and month-end flows between its floor and the wall above. | Short-term trend flips up; opens 4,582, then 4,669–4,700. |
| Base | Most likely: gold chops between the 4,400 floor and 4,524–4,535, capped by the wall, waiting on this week’s jobs data. A small bid from the softer dollar, but no real trend. | Range-bound; month-end flows and the dollar call the tune. |
| Bear | Firmer dollar, hawkish data, or higher oil-and-yields; gold loses the 4,400 floor. | 4,364, then 4,317 and the crowded-long unwind toward 4,280 stays alive. |
For Traders
The crowded long is the whole story for risk here: with so many traders already positioned the same way, a break of the $4,437 floor can feed on itself, so chasing longs into the $4,560–4,573 wall before it is reclaimed is the low-quality trade.
The cleaner read is to let the two lines do the work, respect $4,456 (short-term) $4,560 (long-term) as the floor that keeps the unwind contained, and treat a genuine reclaim of $4,560 as the signal that the pressure has eased.


