The June CPI print has done what three weeks of Hormuz headlines could not: knocked the rate-hike premium out of the dollar. With headline inflation printing -0.4% m/m and core flat, the July hike scenario Governor Christopher Waller floated has effectively been priced out, and the U.S. Dollar Index (DXY) has repriced accordingly, down 0.6% to trade around the 100.65 handle at the time of writing.
Daily Timeframe
DXY Daily Chart, July 14, 2026
Source: TradingView
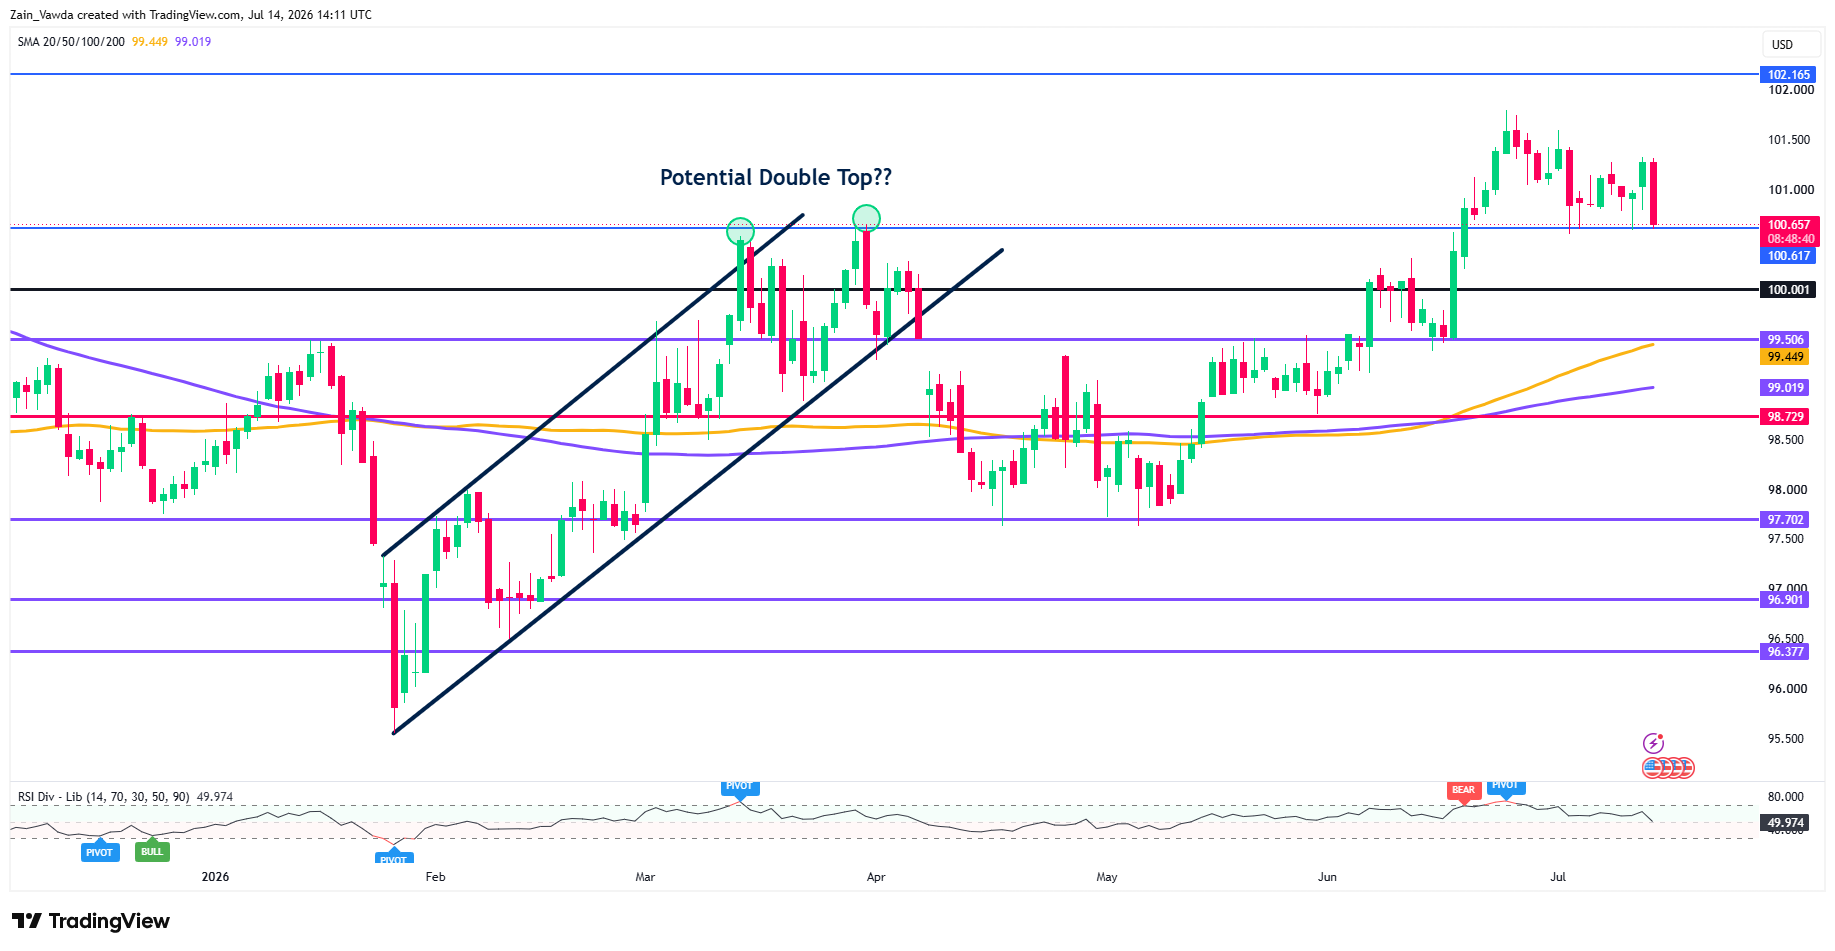
The daily chart keeps the bigger bullish structure intact, for now. The rally off the June lows stalled ahead of 102.165, and today's selloff has brought price straight back into the 100.617 support, the same zone that capped the index during the March–April "double top" and has since flipped into support.
This is the line in the sand. A daily close below opens the psychological 100.00 handle, with 99.506 and the rising 100-day MA (99.449) as the next demand zone.
The 200-day MA at 99.019 continues to climb, and RSI sits at a neutral 50, so one soft print does not yet break the uptrend, it tests it.
Four-Hour Timeframe
DXY Four-Hour Chart, July 14, 2026
Source: TradingView
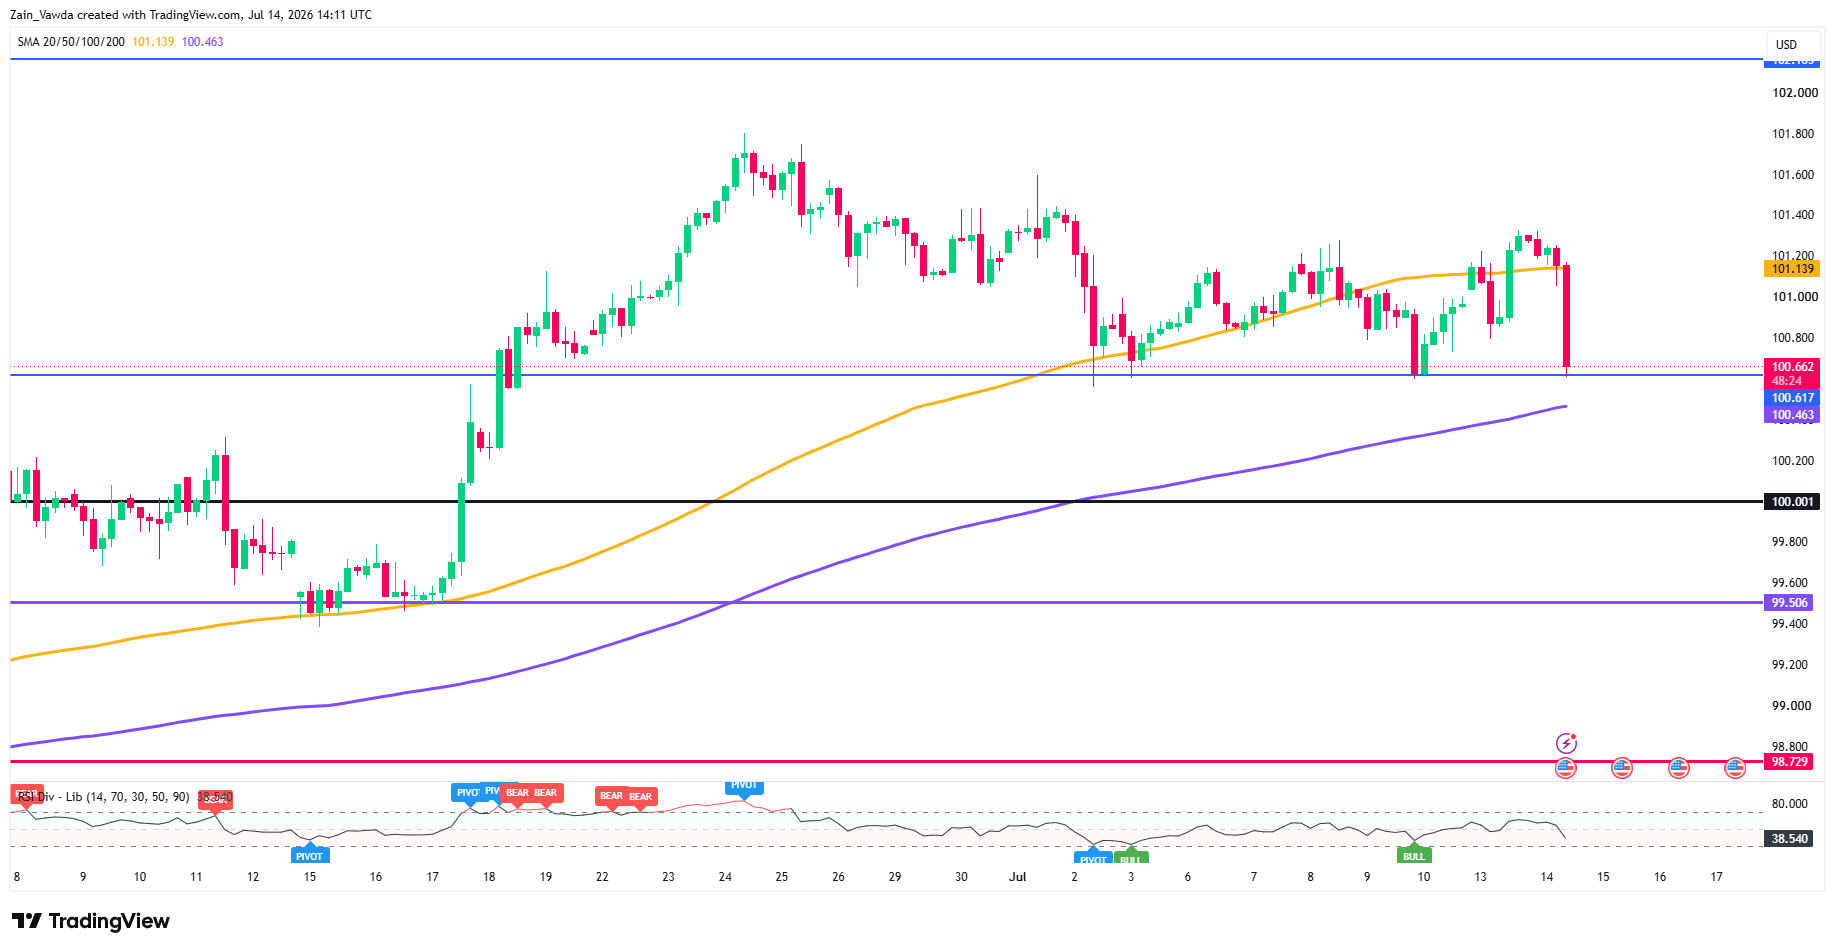
The H4 is where the damage shows.
Price sliced through the 100-day MA at 101.139 in a single impulsive leg and is now pinned against 100.617, with the rising 200-day MA at 100.463 lurking just beneath — a confluence shelf that should attract dip buyers on the first test.
RSI at 38.5 confirms bearish momentum but is not yet washed out, leaving room for an extension toward 100.463 before any meaningful base attempt. Failure there exposes 100.00.
On the topside, 101.139 is now the bull/bear pivot; H4 closes back above it would neutralize the post-CPI move.
One-Hour Timeframe
DXY One-Hour Chart, July 14, 2026
Source: TradingView
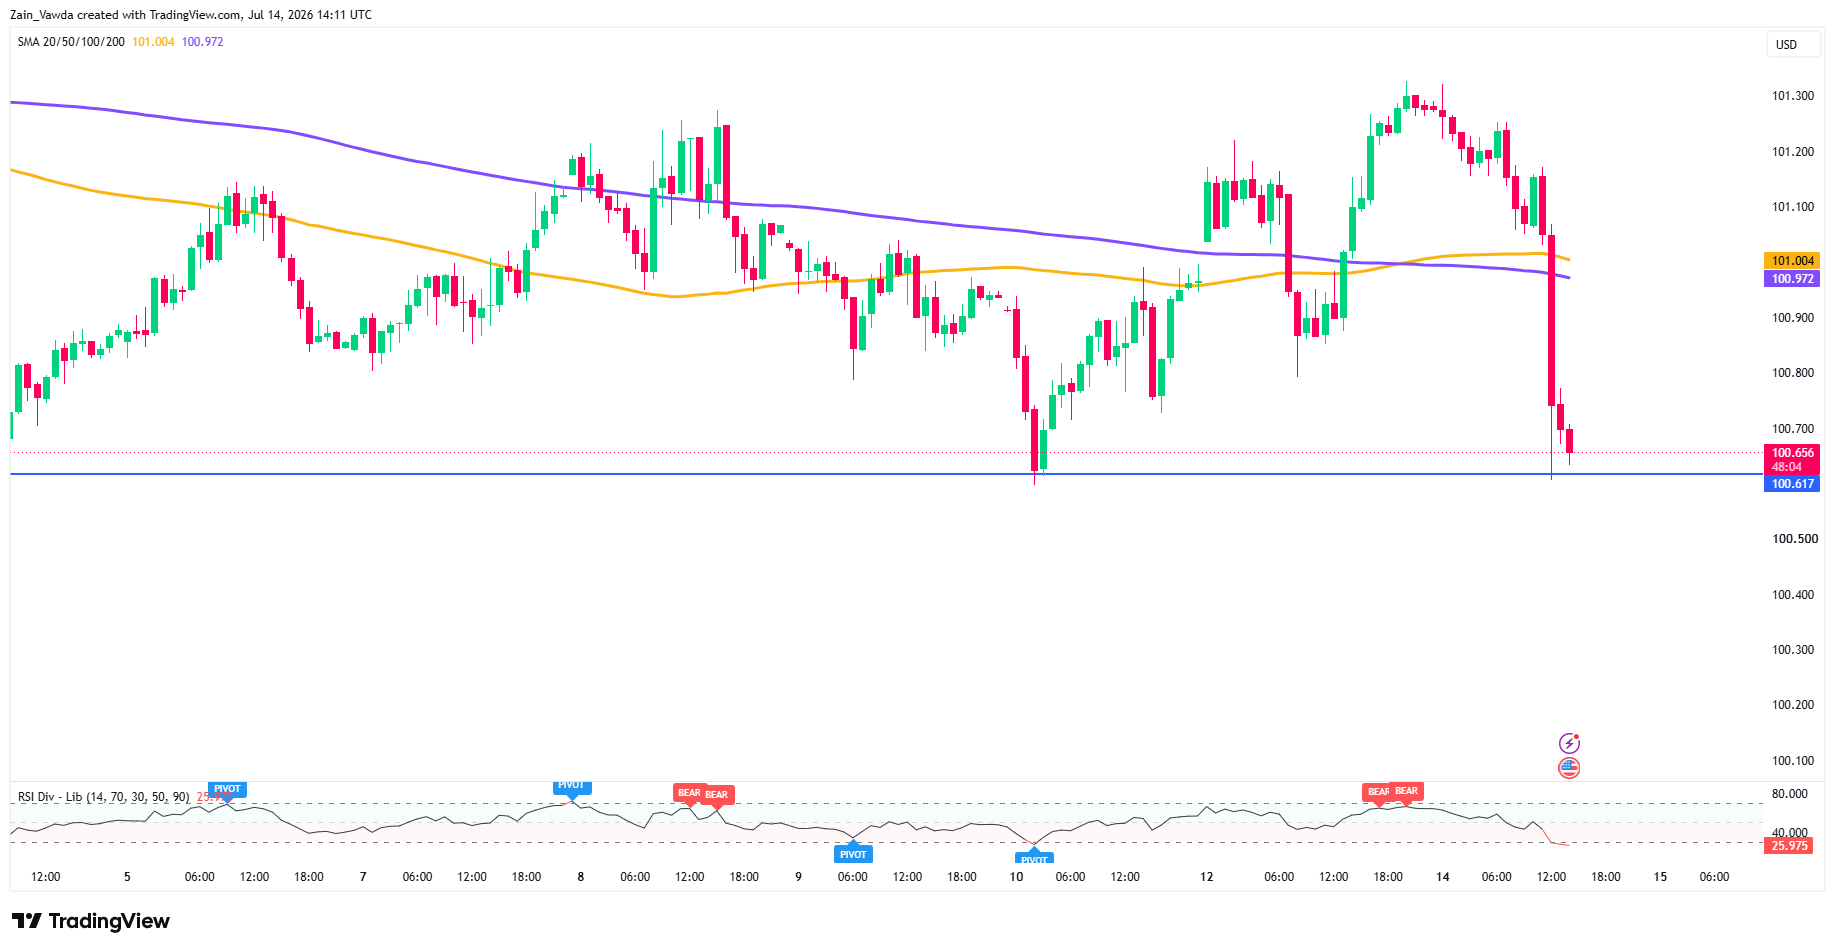
The H1 shows a textbook data-driven waterfall: an uninterrupted run of red candles from the 101.30 area into 100.65, with price now well below the 100- and 200-MA cluster at 100.97–101.00.
RSI at 26 is deeply oversold, the most stretched reading in over a week — which argues against chasing shorts at the lows.
The higher-probability sequence is a relief bounce into the 100.97–101.00 MA cluster, which now acts as first resistance, followed by sellers re-engaging.
Retail Trader Positioning
Retail positioning data indicates a reluctance to hold short exposure today, suggesting a potential market bounce could be imminent. For a deeper breakdown of retail sentiment, refer to the most traded contract tool.
The Catalyst That Remains: U.S.-Iran and the Hormuz Toll Regime
The soft CPI is, in large part, a geopolitical artifact, June's disinflation was driven by crude collapsing during the short-lived ceasefire. That ceasefire is now dead.
Following last week's tanker attacks and fresh exchanges of strikes, Washington has reinstated the naval blockade and moved to keep the Strait open under a cargo levy, sending oil more than 9% higher Monday with oil eyeing $80. This cuts both ways for the dollar.
Renewed escalation feeds a July inflation rebound and revives the hike debate — dollar-supportive — while also inviting classic safe-haven flows into DXY.
Meaningful de-escalation, by contrast, would extend the disinflation impulse and compound today's downside.
In short, today's print may prove a one-month head-fake, which is exactly why the daily uptrend deserves the benefit of the doubt until 100.463 gives way on a closing basis.


