While futures desks have spent the week trading missiles and Fed minutes, a quieter structural story went live over the holiday weekend.
Trump Accounts, the government-seeded children's investment program, formally 530A accounts launched on July 4, and U.S. President Donald Trump marked the occasion by ringing the opening bells for both the NYSE and Nasdaq from the Oval Office on Monday.
More than six million children were enrolled at launch, according to the Treasury Department.
For index futures traders, the headline that matters came from Wells Fargo: the programme is expected to push just over $19.5 billion into U.S. equities in the second half of 2026, with the flows concentrated in the third quarter.
The Mechanics: Why This Money Only Buys
The structure is what makes this interesting for S&P and Nasdaq. Trump Accounts function as custodial traditional IRAs for children under 18, with investment options restricted by the Treasury to a menu of low-cost, broad-market U.S. equity index ETFs, and no withdrawals permitted before age 18.
That combination — mandated US equity allocation, index-only vehicles, locked capital creates a mechanical, valuation-agnostic buyer. Unlike 401(k) contributions, which drip in across the year and diversify across stocks, bonds and other assets, this money arrives compressed into one quarter and flows almost entirely into cap-weighted US equity funds.
By construction, the largest allocations land on the market's biggest names the same mega-cap tech complex that dominates Nasdaq.
The federal side seeds $1,000 for every baby born between 2025 and the end of 2028. But nearly a third of Wells Fargo's projected inflow comes from private pledges: the Dell family has committed more than $6 billion, with Ray Dalio and Brad Gerstner among other backers, and SpaceX President Gwynne Shotwell announced she will donate stock to the programme.
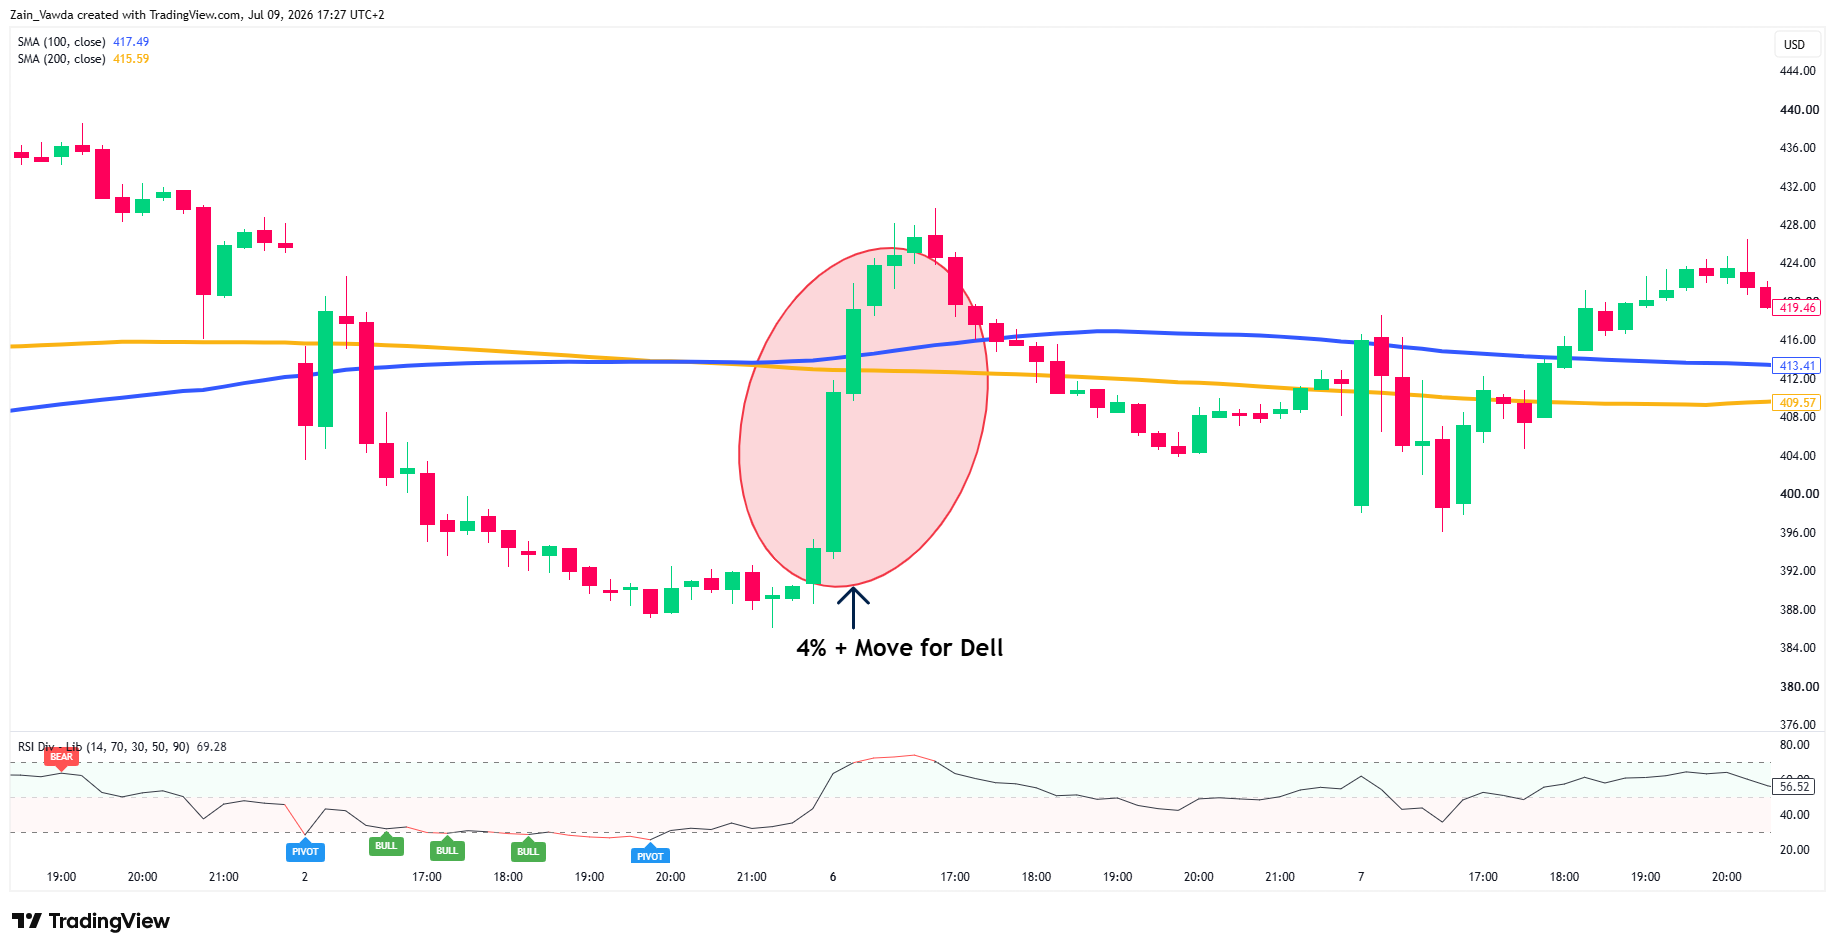
Dell shares jumped 4% on launch day after Trump's Oval Office plug, a small preview of how policy attention can convert into price.
Dell M15 Chart, July 6, 2026
Source: TradingView
According to Ohsung Kwon, an equity analyst at Wells Fargo, the stock market won't experience a foundational shift simply due to fresh capital from Trump accounts. While these financial movements may generate short-term noise. Kwon emphasized that they "would not be a structural driver for equities" on their own.
Sizing It Honestly
Kwon's own caveat deserves equal billing. The $19.5 billion equates to roughly 3% of a full year's 401(k) inflows, rounding error at index scale.
Two things stop it being dismissible.
First, concentration: compressed into a single quarter and a single asset class, the flow punches above its annual-equivalent weight.
Second, trajectory: McKinsey estimates the programme could compound into anywhere from $80 billion to more than $900 billion of long-term asset accumulation for lower-wealth households over the next decade.
H2 2026 is the down payment on a new permanent passive bid, arriving into a market where Goldman Sachs has already warned momentum positioning is highly crowded, meaning marginal mechanical buying lands on an unusually flow-sensitive tape.
Flow Snapshot
| Metric | Figure | Source/Note |
|---|---|---|
| Projected H2 2026 equity inflow | ~$19.5bn, concentrated in Q3 | Wells Fargo (Ohsung Kwon) |
| Accounts enrolled at launch | US Treasury | US Treasury |
| Share from private pledges | One-third | Dell family ($6bn+), Dalio, Gerstner |
| vs. annual 401(k) inflows | +- 3% | Single quarter, equities only |
| 10-year accumulation potential | $80bn–$900bn+ | Mackinsey estimate |
Scenario Matrix — Catalyst: Q3 Inflow Window (July–September)
The potential market outcomes can be broken down into three distinct scenarios.
In an optimistic "Bull" scenario, positive momentum is triggered if account enrollment outpaces the Treasury's six-month estimates and corporate matching pledges multiply.
The "Base" scenario expects standard performance, where financial flows land closely in line with Wells Fargo's original projection of $19.5 billion.
Conversely, a pessimistic "Bear" scenario would unfold if the anticipated inflows prove to be slower than modeled, or if a significant drawdown in the war-premium completely overwhelms the positive flows.
Short-Term Technical Outlook - Nasdaq 100
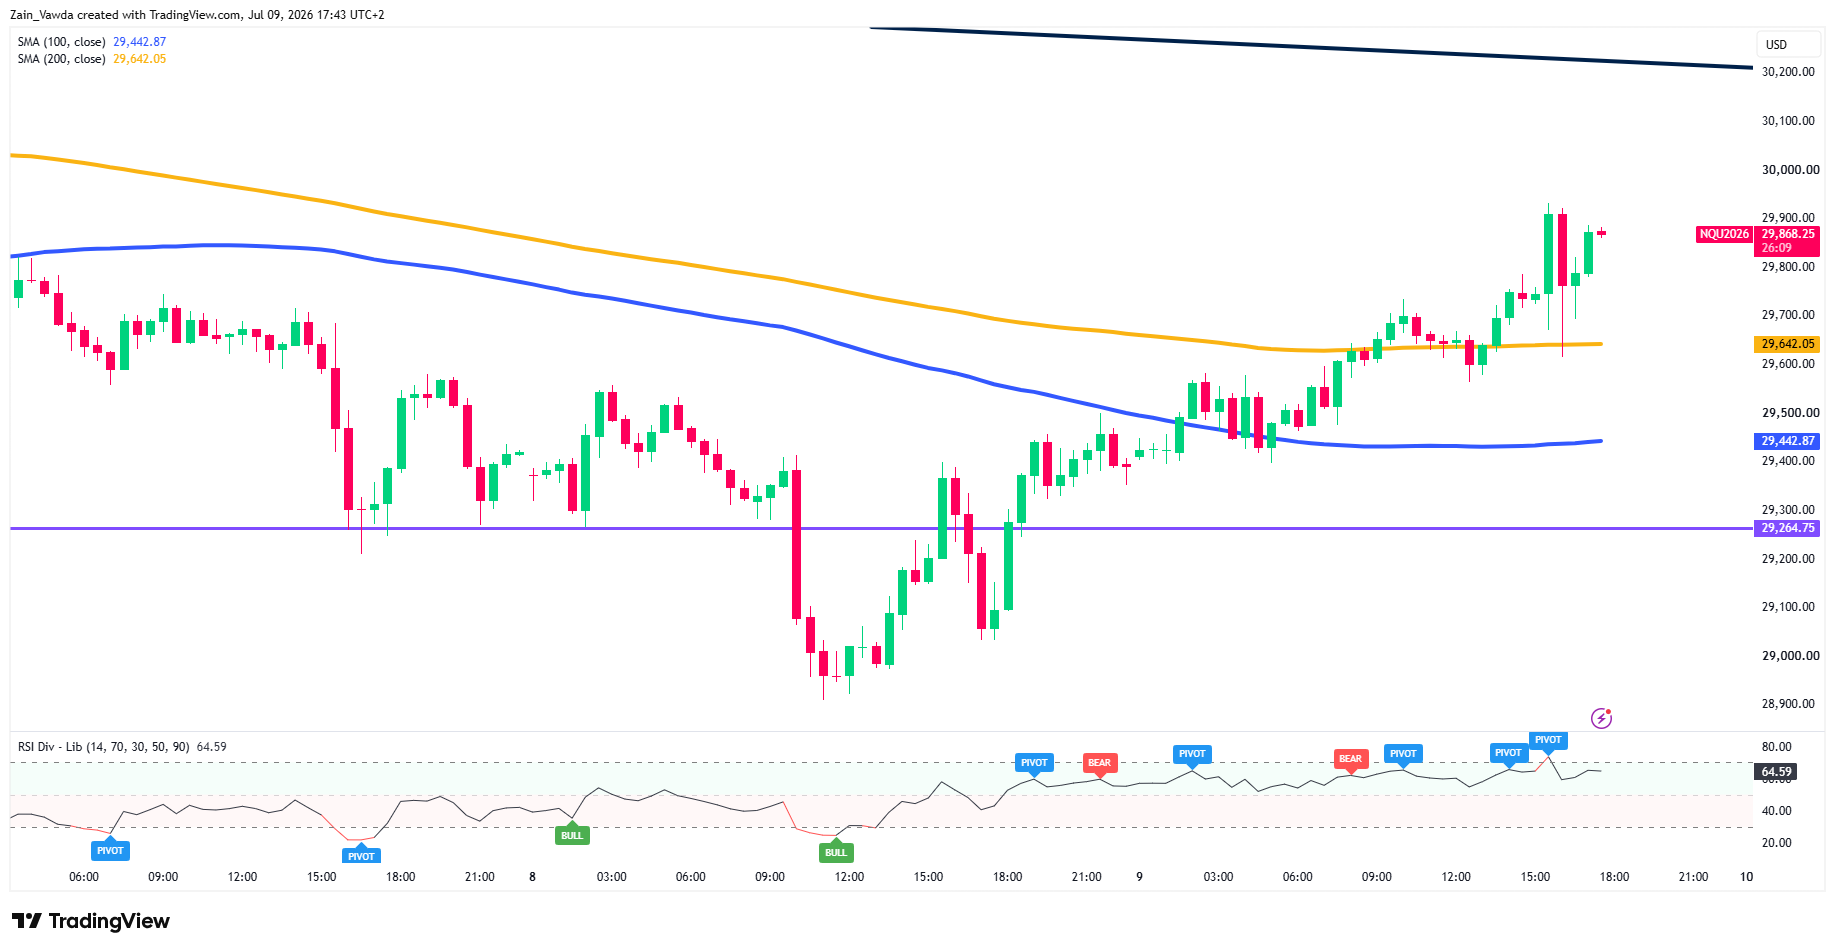
The NQ 15m chart demonstrates strong short-term bullish momentum. Price action has sharply reversed its previous downtrend, clearing both the 100-day MA ($29,528) and the 200-day MA ($29,443) after establishing a solid floor above the purple horizontal support at $29,264.
The index currently trades near $29,868, holding firmly above these major moving averages. While the trend is upward, the RSI has risen to 64.59, nearing overbought territory.
Traders should look for potential near-term consolidation or a minor retest of the 100 MA as support before the rally attempts further continuation.
Nasdaq Futures 15M Chart, July 9, 2026
Source: TradingView
Into Friday, the setup is binary: a strong Hynix open extends semiconductor leadership and validates the AI bid; a stumble hands fresh ammunition to the de-rating camp. Hormuz headlines remain the overnight gap risk, and Tuesday's CPI looms as the ceiling on any rally.
Bias: constructive above 29,000, headline-hostage below.
For retail positioning data and an idea of who's positioned where, take a look at the Trade Validator tool.


