
The Setup: A Jobs Shock Handed the Bulls the Week
Friday rewrote the week's script. July non-farm payrolls didn't just miss — they went negative, a 23,000 outright job loss, with the prior two months revised down a combined 103,000.
In an ordinary cycle that reads as bad news. In a Kevin Warsh Fed that has spent the summer fighting an upside inflation scare, it read as oxygen: a labour market this soft is a labour market that can't force the Fed's hand higher.
The S&P 500 closed at a record 7,758, the Nasdaq added 1.3%, and September hike odds collapsed from roughly 67% a week ago into the low-40s.
Rate-cut pricing, for the record, is still effectively zero. This is a hike-or-hold regime, and Friday buried the hike — for now. Wednesday is where that gets tested.
Why This CPI Lands Differently
At the July 29 meeting the Fed held 9-3, but Warsh stripped forward guidance and skipped fresh projections. That decision matters more than the hold itself: with no dot plot and no guidance, the incoming data is the guidance.
Every major print between meetings now maps almost one-for-one onto September pricing — and July CPI, due Wednesday, August 12 at 8:30 a.m. ET, is the marquee.
It is the first inflation read since the jobs report scrambled the reaction function, and it follows a June print that finally cracked lower: headline 3.5% year-on-year, the first monthly decline of 2026 at -0.4%, with core holding at 2.6%.
The disinflation narrative is fragile, one month old, and about to be stress-tested.
The Number That Matters — and the Oil Wildcard
Watch core month-on-month. The market's base case sits near +0.2%, the kind of benign print that lets the hold thesis breathe. A core reading of 0.3% or hotter is the line that reprices September back toward a coin-flip and drags the long end with it.
Shelter — roughly a third of core — remains the swing factor.
The genuine wildcard sits in the energy complex: Oil (CL) is back near $79 and Brent above $84, bid for a third straight session as Strait of Hormuz reopening hopes fade and Houthi strikes hit Saudi and UAE assets over the weekend. The same barrel driving the geopolitical tape feeds the headline CPI traders are about to price.
Cheaper oil was the disinflation engine into June; a re-bid crude is the tail that can put an upside surprise back on the table.
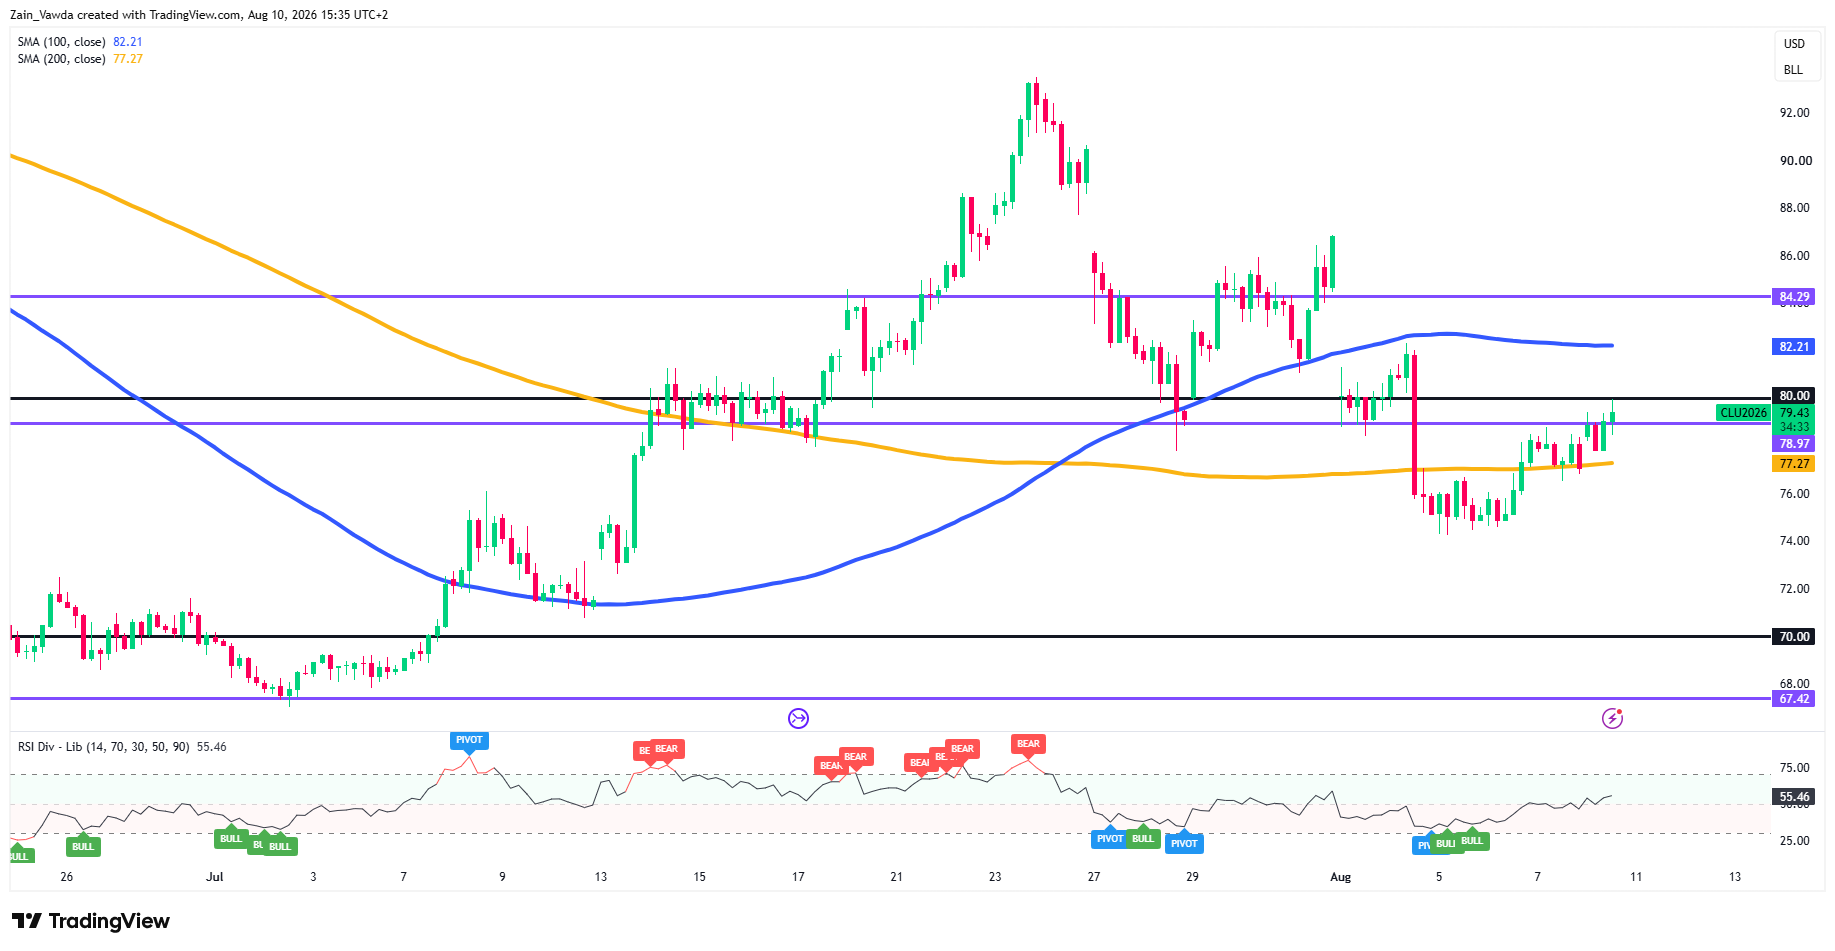
Oil (CL) Four-Hour Chart, August 10, 2026
Source: TradingView
CL has staged a clean recovery off the early-August washout near $74.50, reclaiming the 200-MA at 77.27 and now pressing the $80.00 round number, last ~79.43.
Momentum backs it: RSI at 55.46 is rising with no bearish divergence and room before overbought. Bulls need a 4H close above 80.00 to open the 100-MA at 82.21, then 84.29.
Rejection there keeps price capped and exposed back to 77.27, with the 74.50 base beneath.
Constructive but resistance-heavy into Wednesday's CPI — the print is the catalyst that decides whether $80 breaks or caps.
The variable: News reported over the weekend suggested that U.S. President Donald Trump may be okay with ending the war without a nuclear deal with Iran.
If such a move comes to pass or any other development around Iran and the Strait of Hormuz may have significant impacts on oil prices.
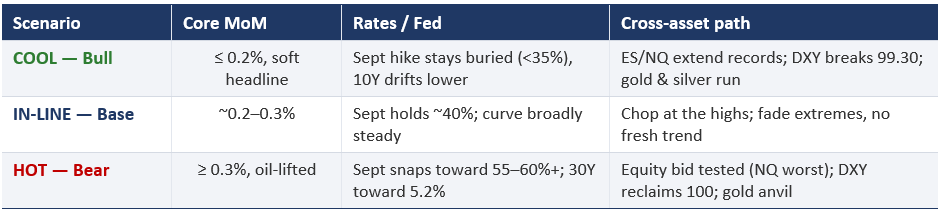
Three Ways Wednesday Breaks
Scenario Matrix
Source: Created by Zain Vawda
Retail Trader Sentiment
The Positioning Edge Tool on Marketframework provides futures traders with a crucial edge by visualizing the balance between profitable and unprofitable traders. By comparing the price action with the aggregated P&L of market participants, it helps you identify potential turning points and "trapped" positions.
This gives you a clear view of market sentiment that goes beyond simple price charts. Don't trade in the dark; visit the Positioning Edge Tool to explore how this unique edge can enhance your trading strategy.


