
The question I left open on Thursday — whether Friday’s payrolls would seal the dollar’s break below 100 — has an answer. It did.
The July employment report didn’t simply miss; it printed an outright job loss, and the US Dollar Index fell through the last of its overhead structure to trade around 99.43, roughly 0.5% lower on the session.
The rate premium that carried DXY to 101.7 in July has now drained almost entirely out of the tape.
The Print That Broke the Dollar
Nonfarm payrolls fell by 23,000 in July— the first outright decline in months — against a consensus clustered near +83K to +95K. Private payrolls managed a thin +30K, but a 53,000 drop in government jobs dragged the headline negative.
The revisions were arguably worse than the print itself: May was cut by 66,000 and June by 37,000, hollowing out the prior two months.
Average hourly earnings rose two cents — essentially flat — pulling annual wage growth down to 3.2%, the softest since May 2021.
The unemployment rate ticked down to 4.1% from 4.2%, and it was the worst line in the report. It fell because the labor force participation rate slid to 61.4%, a level unseen in over five years — people leaving the workforce, not finding jobs.
A lower jobless rate for the wrong reason is not the strength the dollar needed.
The Rate Premium Drains
This is the oil-dollar inversion I’ve tracked since July running fully in reverse. Through the summer, the dollar traded its rate path higher as oil-fed inflation fear built a hike premium into the curve. That premium is now unwinding on both inputs at once — cheaper crude and a cracking labor market.
Fed funds futures cut September hike odds to roughly 40% from 55% before the data, and CME’s FedWatch now leans toward a hold.
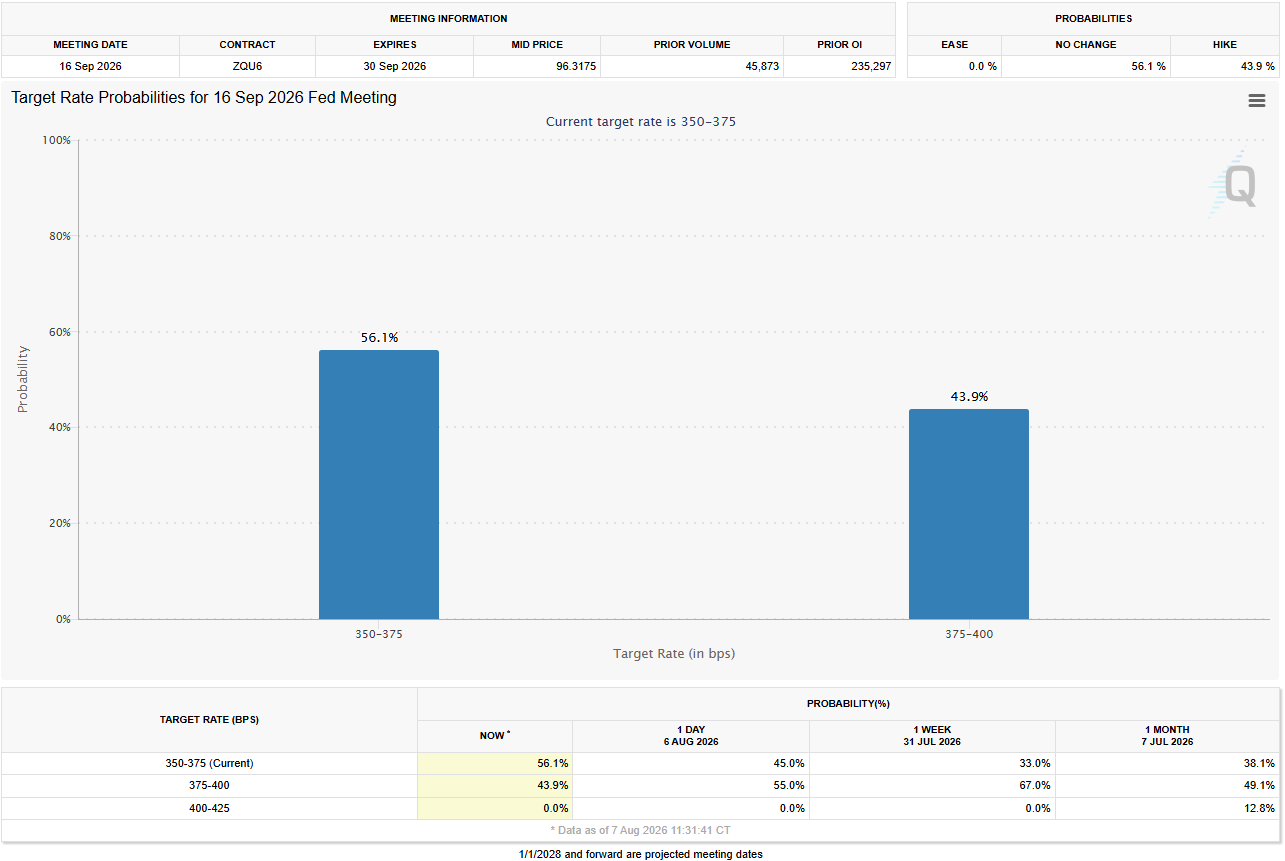
Source: CME FedWatch
The Fed held 9-3 in late July, with several officials still openly campaigning for a September hike if inflation refused to ease. This report makes that case far harder to argue: a committee with a full-employment mandate cannot look through an outright job loss.
The next hinge is July CPI on August 12 — the only release left with the weight to put the hike premium back.
US Dollar Index (DXY) Technical Outlook
The fundamental shift corresponds with a clear technical breakdown across both medium-term and short-term timeframes.
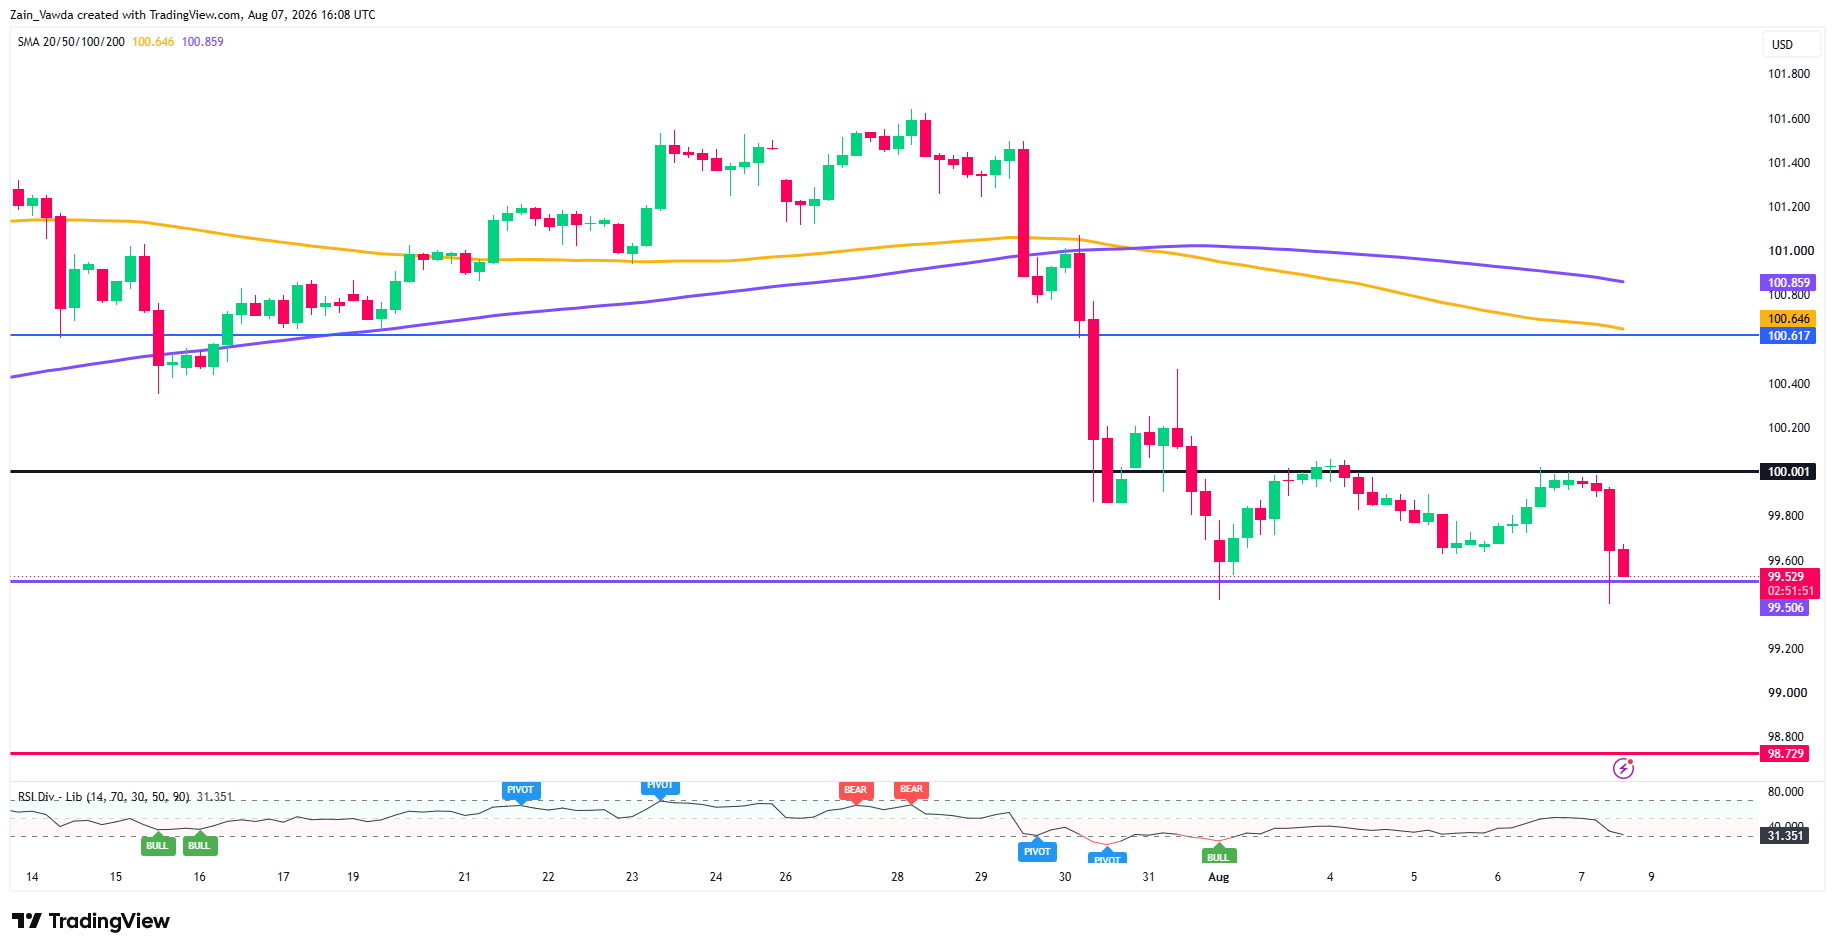
4-Hour Chart (4H): Structural Breakdown & Critical Target Levels
The 4-hour timeframe confirms significant structural damage to the dollar's multi-month recovery:
- Double Top Pattern: Price action confirms a Double Top structure around the 100.617 resistance zone, completing a breakdown out of the prior ascending wedge channel.
- Immediate Support Zone: The index is currently attempting to hold the 99.506 horizontal boundary, with the 50 SMA residing nearby at 99.731.
- Key Support Levels Below:
- 99.181: 100 SMA dynamic support level.
- 98.729: Major structural horizontal floor and 200 SMA confluence.
- 97.702: Secondary long-term support level.
- 96.901 – 96.377: Macro range support floor.
- Overhead Resistance: Any corrective bounce will encounter immediate supply at 100.001, followed by strong resistance at 100.617.
US Dollar Index Four-Hour Chart, August 7, 2026
Source: TradingView
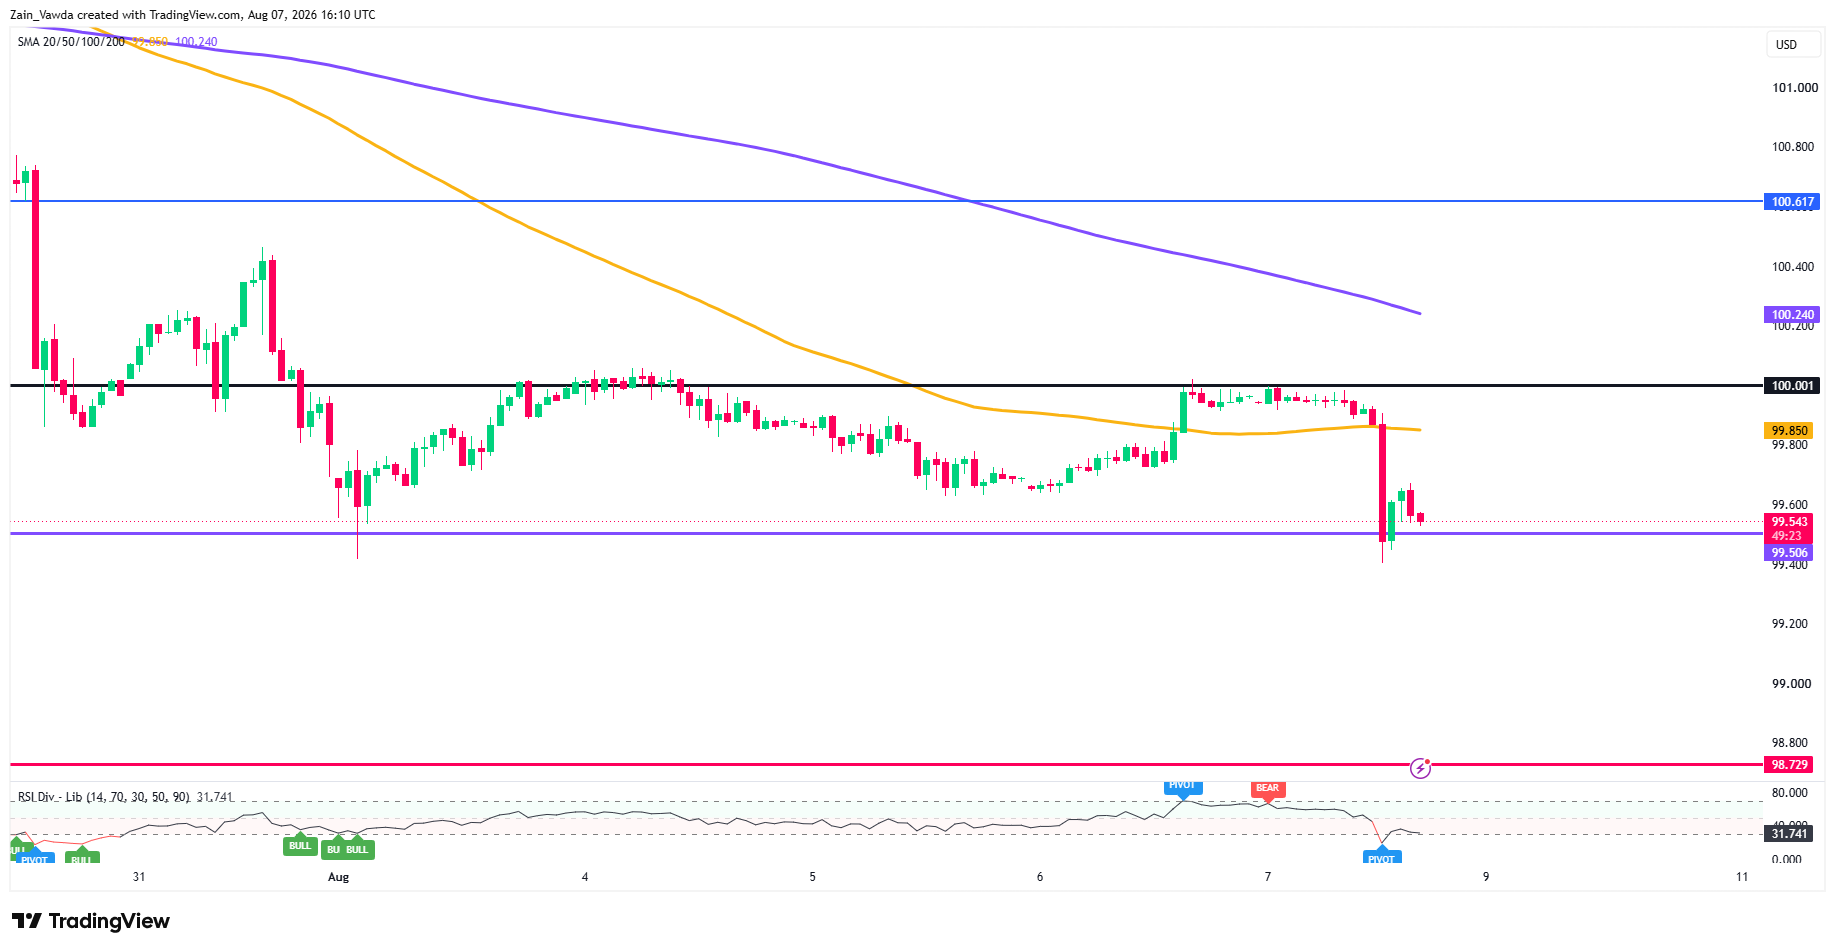
1-Hour Chart (H1): Breakdown Below 100.00
The hourly chart highlights an aggressive, impulsive reaction to the labor release:
- Loss of Psychological Handle: The DXY plunged through the major 100.001 pivot line in a single wide-range red candle.
- Testing Key Horizontal Support: Price dropped directly to test the 99.506 purple horizontal support line, trading near 99.529.
- Moving Average Resistance: Both the 100 SMA (100.646) and 200 SMA (100.859) are sloping downward well above current spot prices, confirming strong short-term bearish dominance.
- Oversold RSI: The Relative Strength Index (14-period) sits deep in oversold territory at 31.35. While this signals strong selling momentum, it also suggests the potential for short-term consolidation or a mild retest before the next leg lower.
US Dollar Index One-Hour Chart, August 7, 2026
Source: TradingView
Key Takeaways & Forward Path
The softer NFP data has fundamentally shifted market sentiment from hawkish Fed expectations to a prolonged pause. Unless upcoming economic releases—such as the upcoming CPI report or comments at the Jackson Hole Symposium—deliver unexpected hawkish surprises, the path of least resistance for the US Dollar points lower.
Technically, a sustained 4-hour or daily close below 99.506 opens the door for a extended move toward 98.729 and potentially 97.702.


