Where Gold Stands Right Now
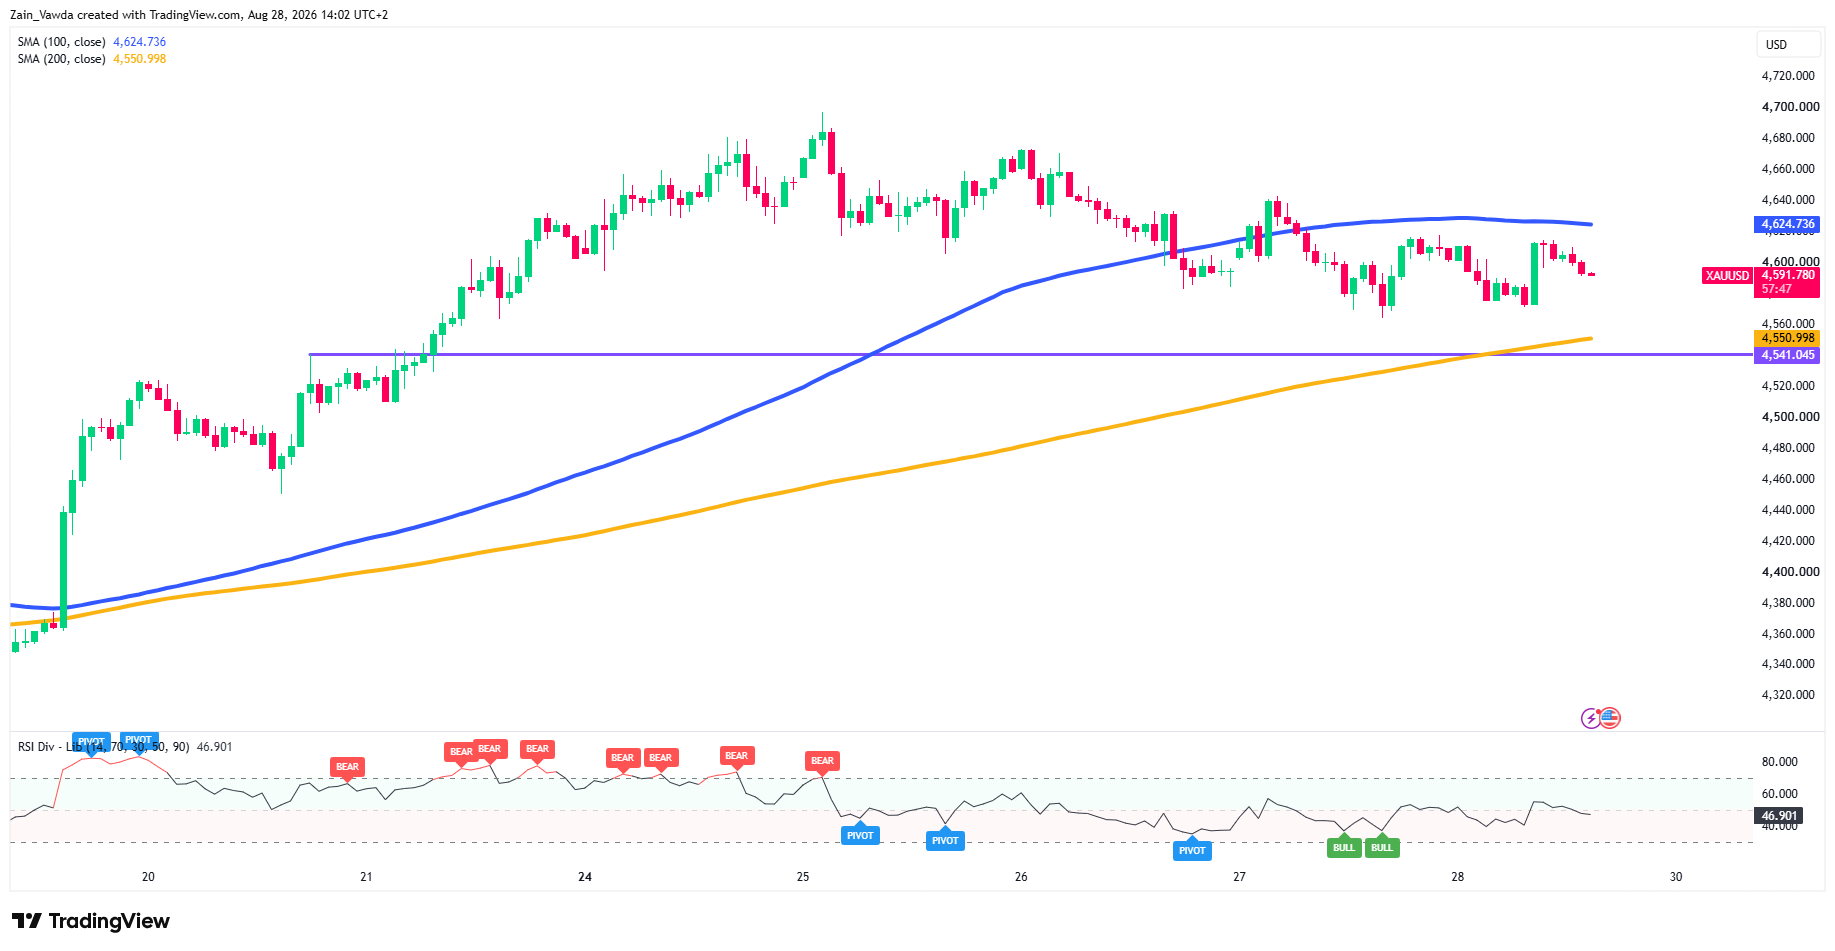
Gold (XAU/USD) is trading near $4,592 on the one-hour chart, and it is stuck. Price is sitting in the middle of a tight band, with a clear ceiling above and a clear floor below.
The ceiling is the 100-hour moving average at about $4,625. (A moving average is simply the average price over a set number of hours, traders watch it to read the short-term trend.) That line has flattened out and is now capping every bounce.
The floor is a two-part support zone: the 200-hour moving average near $4,551, and a price shelf just under it at $4,541. Gold pushed toward $4,700 earlier in the week but was rejected, and it has drifted lower since.
Momentum agrees with the “stuck” picture. The RSI, a gauge of buying versus selling pressure is sitting just below the 50 midpoint at around 47. That is a slight lean lower, but nothing decisive.
Gold (XAU/USD) One-Hour Chart, August 28, 2026
Source: TradingView
Why Gold Can't Pick a Direction
Two forces are pulling against each other.
Pulling gold down: U.S. long-term bond yields are high, with the 30-year near levels last seen in 2007, and the dollar is firm above 99 on the index. Gold pays no interest, so when bonds pay more and the dollar is strong, gold looks less attractive.
Pulling gold up: the so-called debasement trade. Investors are worried about America’s growing debt and about the Treasury stepping in to hold long-term yields down. That kind of move leaning on the bond market to cap borrowing costs pushes some buyers into gold as a hedge, and steady demand out of China has added to it.
With both sides roughly balanced, gold simply sits in its box.
The Event that Could Break the Tie: Warsh at 10am ET
Federal Reserve Chair Kevin Warsh gives his first Jackson Hole speech today at 10:00 a.m. New York time (ET). It matters more than a usual speech because Warsh has removed the Fed’s forward guidance so traders have far less to lean on, and every word carries extra weight.
The debate itself is unusual: the market is pricing the chance of a rate hike, not a cut, with September hike odds around 38%. Most fund managers expect Warsh to sound neutral, and that is the key. When everyone is braced for neutral, it is a surprise in either direction that moves the market.
Three Ways Today Could Play Out
| Scenario | What Warsh Does | Gold Impact | Levels to Watch |
|---|---|---|---|
| Bullish | Sounds softer than feared; the dollar and yields slip | Clears the $4,625 ceiling and runs at the range top | $4,625 → $4,660 → $4,700 |
| Base | Neutral, as most expect; little repricing | Keeps chopping inside the box | Holds $4,551 – $4,625 |
| Bearish | Sounds more hawkish; the dollar and yields jump | Loses the $4,541–$4,551 floor and opens downside | $4,541 → $4,500 → below $4,500 |
Retail Trader Positioning
Data from the MarketFramework Positioning Tool showed an extreme bullish divergence alongside a 14% volume increase. A substantial 32% sentiment gap has opened between trader tiers: profitable traders are 82% long (peaking near 84%), while unprofitable traders sit at 50% long.
This widening divergence shows high-conviction accumulation by profitable accounts at the time of writing, whereas unprofitable accounts remain split or counter-positioned. When profitable traders heavily lean long while retail/unprofitable traders lag, it signals strong institutional/smart-money alignment and supports a bullish upward bias for gold futures.


