Gold has walked into the new week on the back foot but swinging. The metal closed lower for a second straight week into Friday and slipped again on Monday.
It tried to rebound early Tuesday, but has since drifted back to around $4,400, sitting right on its hourly 100-period average and just under the $4,437 line that has capped every bounce this week.
In plain terms: sellers had control into the weekend, and the buyers keep stalling at the same ceiling.
How Gold Started the Week: A Straight Tug-of-War
Two forces are pulling in opposite directions.
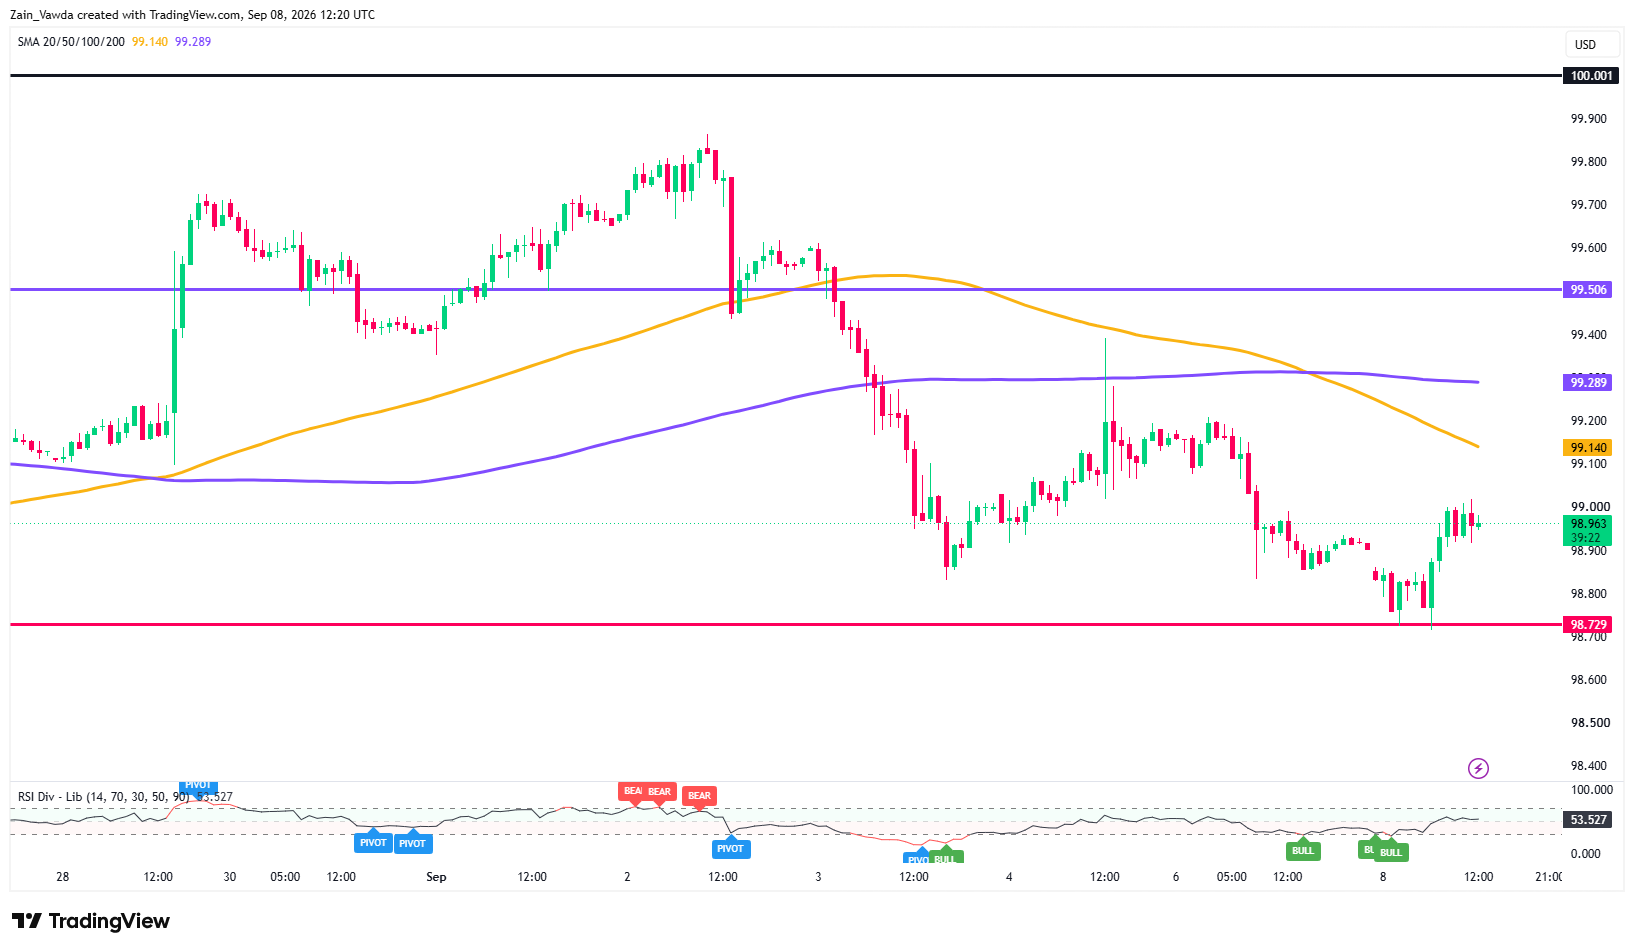
On the bullish side, the U.S. dollar has sagged to two-week lows.
US Dollar Index (DXY), One-Hour Chart, September 8, 2026
Source: TradingView
That has almost nothing to do with the U.S. and almost everything to do with Japan: the yen has surged to a seven-month high as traders bet the Bank of Japan hikes rates next week, dragging USD/JPY down toward 153.50. A cheaper dollar makes gold cheaper for the rest of the world to buy, so it lifts price.
On the bearish side sits the real problem for gold: rates. Friday’s hot U.S. jobs report (162k new jobs versus about 53k expected) pushed the odds of a September Fed rate hike to roughly 59–60%, and the renewed U.S.-Iran fight around the Strait of Hormuz has kept oil pinned at six-to-seven-week highs.
Higher oil feeds inflation fear, which keeps the Fed leaning hawkish, which pushes the 10-year Treasury yield up near 4.78%, close to a three-year high. Gold pays no interest, so when yields climb, the cost of holding it climbs too. That is the anchor competitors are all writing about.
Our Edge: What the Crowd is Actually Holding
Here is what the dollar-and-levels coverage leaves out.
The Commitment of Traders (CoT) report, the weekly U.S. regulator snapshot of who is positioned where in the futures market shows that “managed money” (the hedge-fund and CTA crowd, the fast money) is sitting on a very large long bet.
Net longs recently hit about 145,000 COMEX gold contracts, the highest since September 2025.
Two details matter for the next day.
First, the shorts are tiny (around 13–15k contracts), so last week’s dip was longs cashing out, not new sellers piling in.
Second, and this is the catch the desk always flags: the freshest CoT data is only current to 1 September and was published before Friday’s jobs-driven sell-off and this week’s bounce.
So the snapshot is a week stale, it cannot yet show whether the crowd got scared out on Friday or dug in.
The read-across is simple. A crowded long with almost no shorts is asymmetric: there is little short-covering fuel left to power a big rally, but plenty of long-liquidation risk if Friday’s CPI runs hot.
That is why the bank cheerleading, Standard Chartered today lifting its targets to $4,750 (3-month) and $5,000 (12-month), with others already at $5,000-plus is a medium-term story, not a next-24-hours safety net.
The Next 24 Hours: The Lines that Decide It
There is no top-tier U.S. data in the next day as Tuesday brings only second-tier releases (small-business optimism, consumer credit). This means the session is about U.S. traders returning from the long weekend, reacting to the weekend Iran headlines, and repositioning ahead of Thursday’s PPI and Friday’s CPI.
On the macro side, watch the dollar (a falling USD/JPY helps gold) and oil (firm crude hurts it through higher yields).
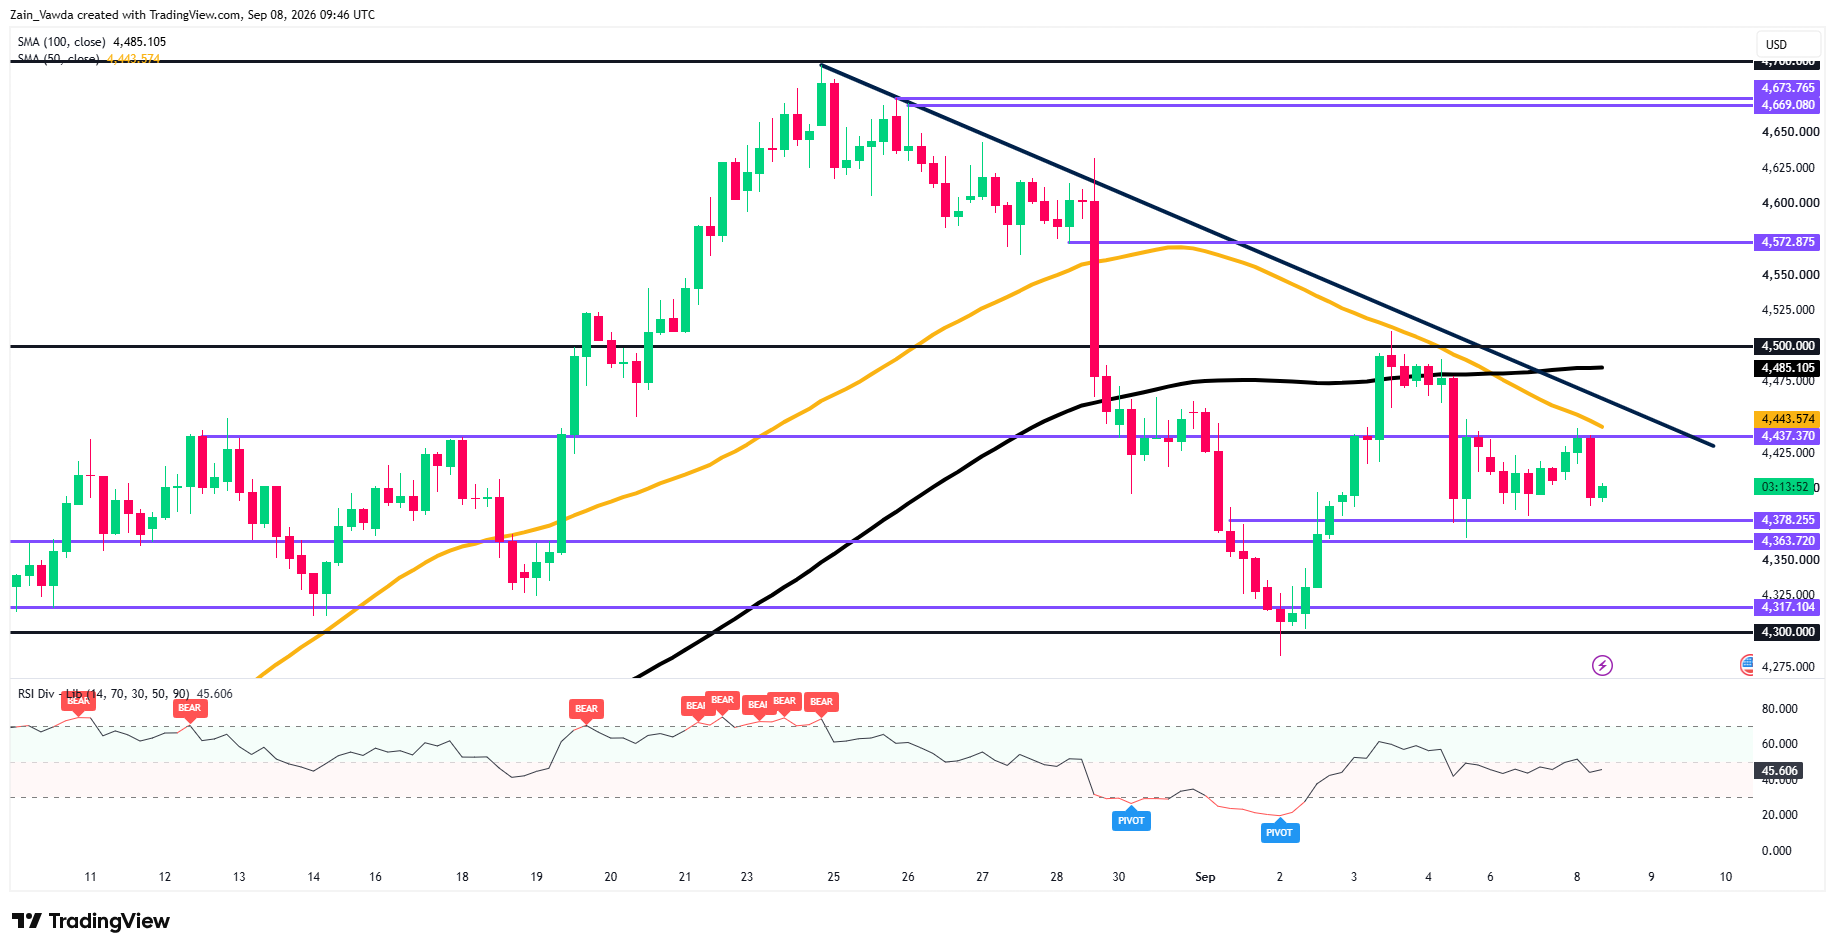
The chart says be patient. On the 4-hour timeframe the trend is still down: price is making lower highs off the 25 August peak, trapped under both its 50- and 100-period averages (about $4,443 and $4,485) and under the falling trendline drawn from that high.
Gold H4 Chart, September 8, 2026
Source: TradingView
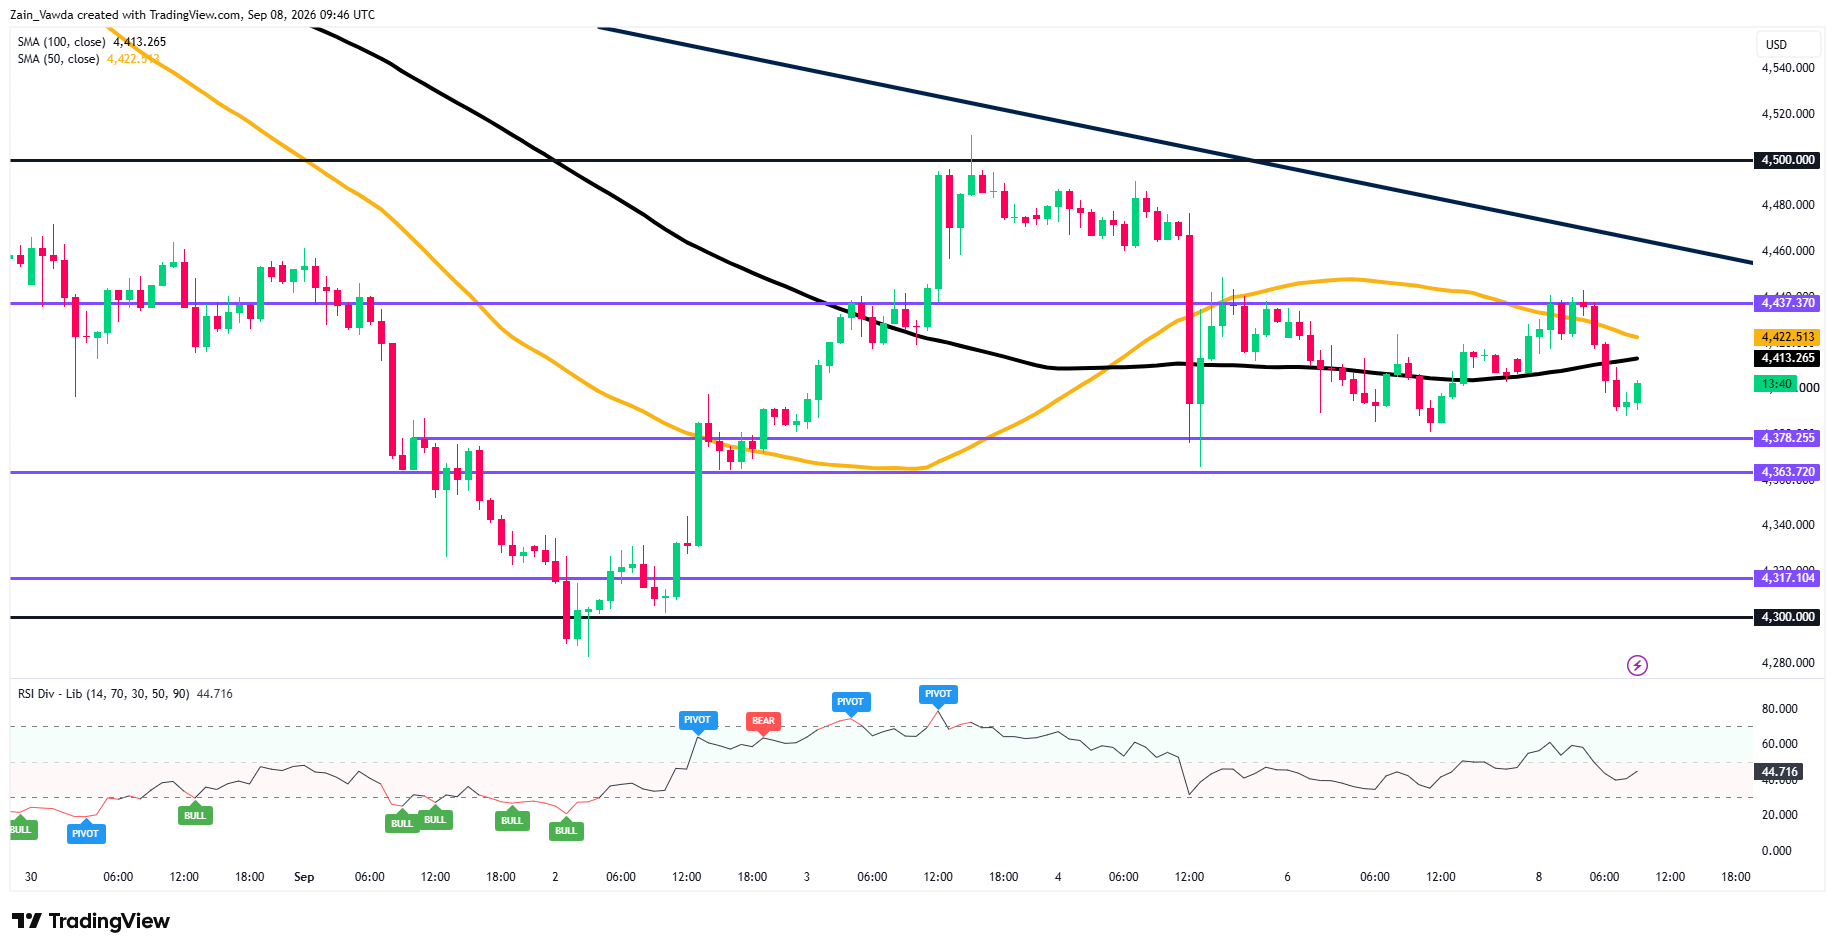
On the 1-hour chart it is more of a coin-toss, price is pinned on its flattening averages near $4,413–$4,422, with momentum (the RSI) stuck below the 50 mid-line on both timeframes. So the higher timeframe leans bearish while the lower timeframe waits.
Gold H1 Chart, September 8, 2026
Source: TradingView
The single line that decides the next 24 hours is $4,437 (reinforced by the 4-hour 50-average just above it).
Reclaim and hold above it and gold opens the trendline and the $4,485 average, then $4,500. Get rejected there, the more likely outcome while the crowd is this long and the range stays heavy, with $4,378 the first support, then $4,363 and the $4,317–$4,300 shelf.
The positioning picture is a discipline test. Consistently profitable traders tend to respect crowded extremes, they wait for gold to actually reclaim the $4,437 trigger before paying up for longs, and they size down when the fast money is already all-in and the catalyst (CPI) is still two days away.
With shorts this thin, the pain trade is a fast drop that forces the crowd out, not a melt-up.


