Bitcoin is doing something that looks like nothing and means quite a lot. The price has slipped back toward $64,000, down more than 1% on Tuesday after a fourth failed attempt to hold above $65,000 and on the surface that reads as another listless session in a market gone quiet, with global crypto volumes running at three-year lows.
Look underneath and the stall is anything but idle. It is a genuine tug-of-war: record accumulation by the largest holders and a recovered ETF bid on one side, persistent over-the-counter selling from Strategy and the mining sector on the other, all coiling into Wednesday's US inflation print.
This is the same range we flagged as coiling, not dying, now compressed to a finer point, with a clearer fuse.
The Range Holds, But the Character of the Stall is Constructive
Nexo's Iliya Kalchev argues it is “not the failure itself but the character of it” that matters: the absence of aggressive selling into $65,000 points to shorts stacking above the level rather than holders cashing out, the kind of setup that can break faster than the grind implies, with $70,000 the next objective if $65,000 gives way.
The options market leans the same way. CF Benchmarks notes the CME bitcoin volatility index touched a multi-year low near 35.5 in early August, leaving upside calls unusually cheap against the downside protection traders keep paying up for, a market braced for a drop that may be mispricing the squeeze.
The Two Sellers Capping the Tape: Strategy and the Miners
The reason the bid keeps stalling is supply, from two familiar names.
Strategy, long the market's marginal corporate buyer, is now a seller: roughly 6,948 BTC offloaded since May for about $432 million, the latest ~1,690 coins last week, funneled into preferred-stock buybacks and dividends under a framework authorizing up to $1.25 billion in sales with a larger $5 billion liquidation authorization now hanging over sentiment.
Michael Saylor's refinement that the goal is to “never be a net seller” is doing a lot of work.
The second seller is the miners, and their story is structural: Riot's reported $9 billion, twenty-year compute deal with Anthropic is the clearest sign yet the sector is pivoting from mining bitcoin to hosting AI, with hashprice near $32/PH/s pushing a fifth of the fleet toward losses.
Near term that means steady OTC coin sales; longer term it thins the ranks of forced sellers and locks megawatts away from the network for a decade.
Under the Surface, the Strongest Hands are Loading Up
While retail retreats, micro-wallets have shrunk through August amid the $120 million Coldcard exploit and the Clarity Act's slip to September, the giants are buying.
Wallets holding at least 10,000 BTC have climbed to 90, a six-month high, and addresses in the 10–10,000 range have added roughly $1.5 billion since late July. Santiment frames it as a classic rotation from weak hands to strong, the kind that has historically preceded upside.
Flows corroborate: US spot bitcoin ETFs took in more than $850 million last week, their best since mid-April, though the week opened with a $144 million outflow, the caution flag into CPI.
CoinShares' James Butterfill leans bullish, expecting a higher year-end close on cheap valuations, reset positioning, returning ETF demand and a less restrictive Fed.
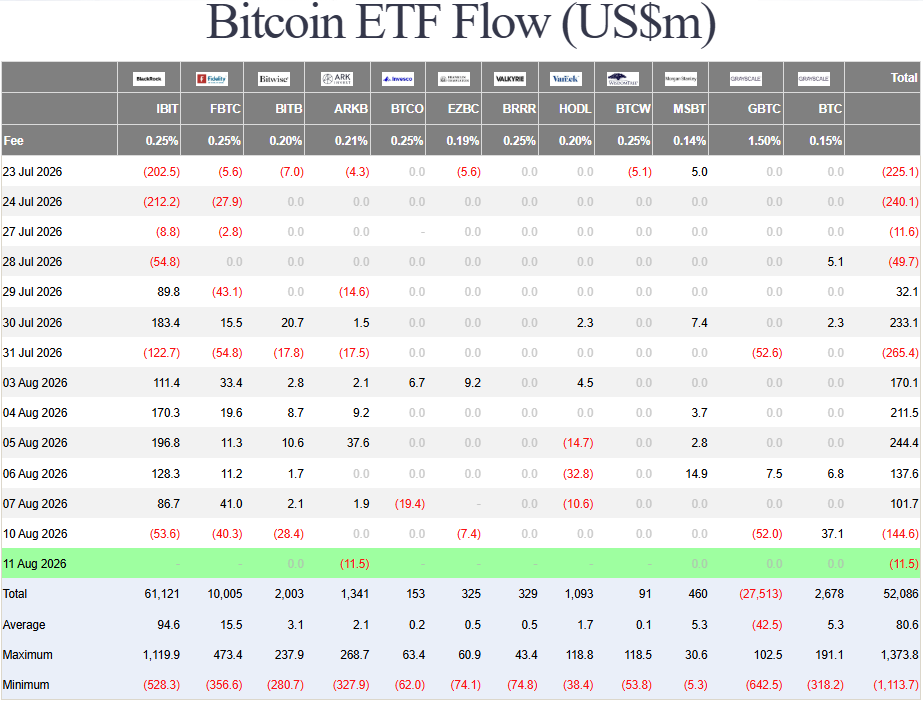
Source: Farside Investors
Scenario Matrix — Keyed to July CPI, Wed Aug 12, 8:30 ET
Wednesday's CPI print has the ability to inspire a breakout but the question will be whether any breakout will be sustainable.
CPI is expected to ease to roughly 3.4% headline and 2.5% core. Bitfinex cautions that a September hold is not a dovish pivot, saying “the hike is being priced out, but easing is not being priced in” so the reaction cuts both ways.
Potential Scenarios
| CPI Path | Bitcoin Bias | Level Map | What Confirms It |
|---|---|---|---|
| Cool/Soft | Bullish Break | $65K clears → $68K → $70K target | Daily close >$65K on ETF-inflow follow-through |
| In-Line (3.4%/2.5%) | Range Persists | $64K–$67K coil holds; $65K the line | Neither $65K reclaim nor $64K loss — accumulate the edges |
| Hot/Hawkish | Rapid Reversal | $64K floor breaks → $60K → $58K cycle-low | Loss of $60K flips the weak-hand thesis (Santiment) |
Technical Analysis - Bitcoin
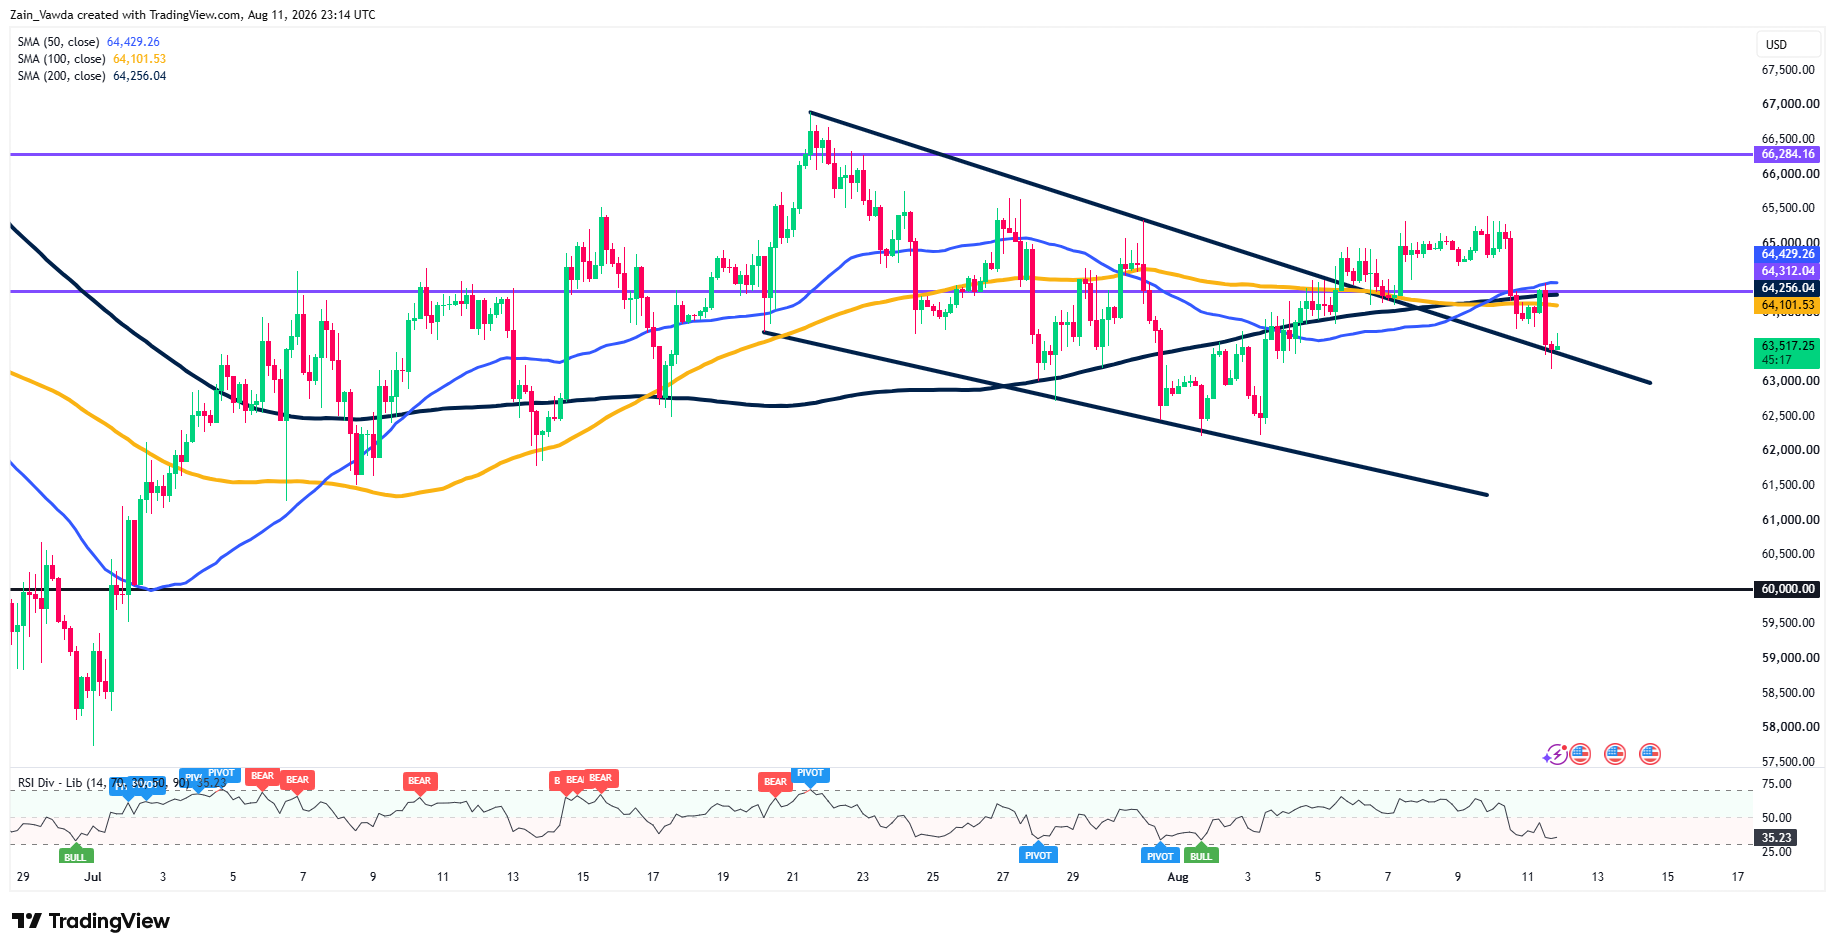
BTCUSD (H4) has rolled over hard off the $65,000 ceiling, sliding to 63,517 and slicing back below the 50/100/200-MA cluster (64,101–64,429) that had been coiling into apex.
Price is now testing the lower rail of the descending wedge near $63,500, lose it and $63,000, then the $60,000 floor, come into play.
Bitcoin Four-Hour Chart, August 11, 2026
Source: TradingView
RSI has broken down to 35.23, its weakest of the range, confirming the momentum shift ahead of CPI.
The failed breakout above the MAs flips them into resistance, so bulls need a fast reclaim of $64,100–$64,300 to keep the wedge intact; otherwise the coil resolves lower, a bearish tilt into Wednesday's print.


