The index tape has quietly swapped leaders. Through the record run into August 5–6 it was the Dow (YM) doing the heavy lifting, blue-chip rotation carrying price to fresh highs while the Nasdaq (NQ) lagged, still stitching its June breakdown back together.
NQ has repaired the damage, reclaimed its broken downtrend and both major averages, and coiled into a tight symmetrical triangle right beneath resistance.
YM, by contrast, has stalled and rolled off the highs and gone sideways at a flattening moving-average cluster it cannot decisively reclaim. Two very different setups, one shared catalyst.
Nasdaq (NQ): The Coil Tightens Below 29,900
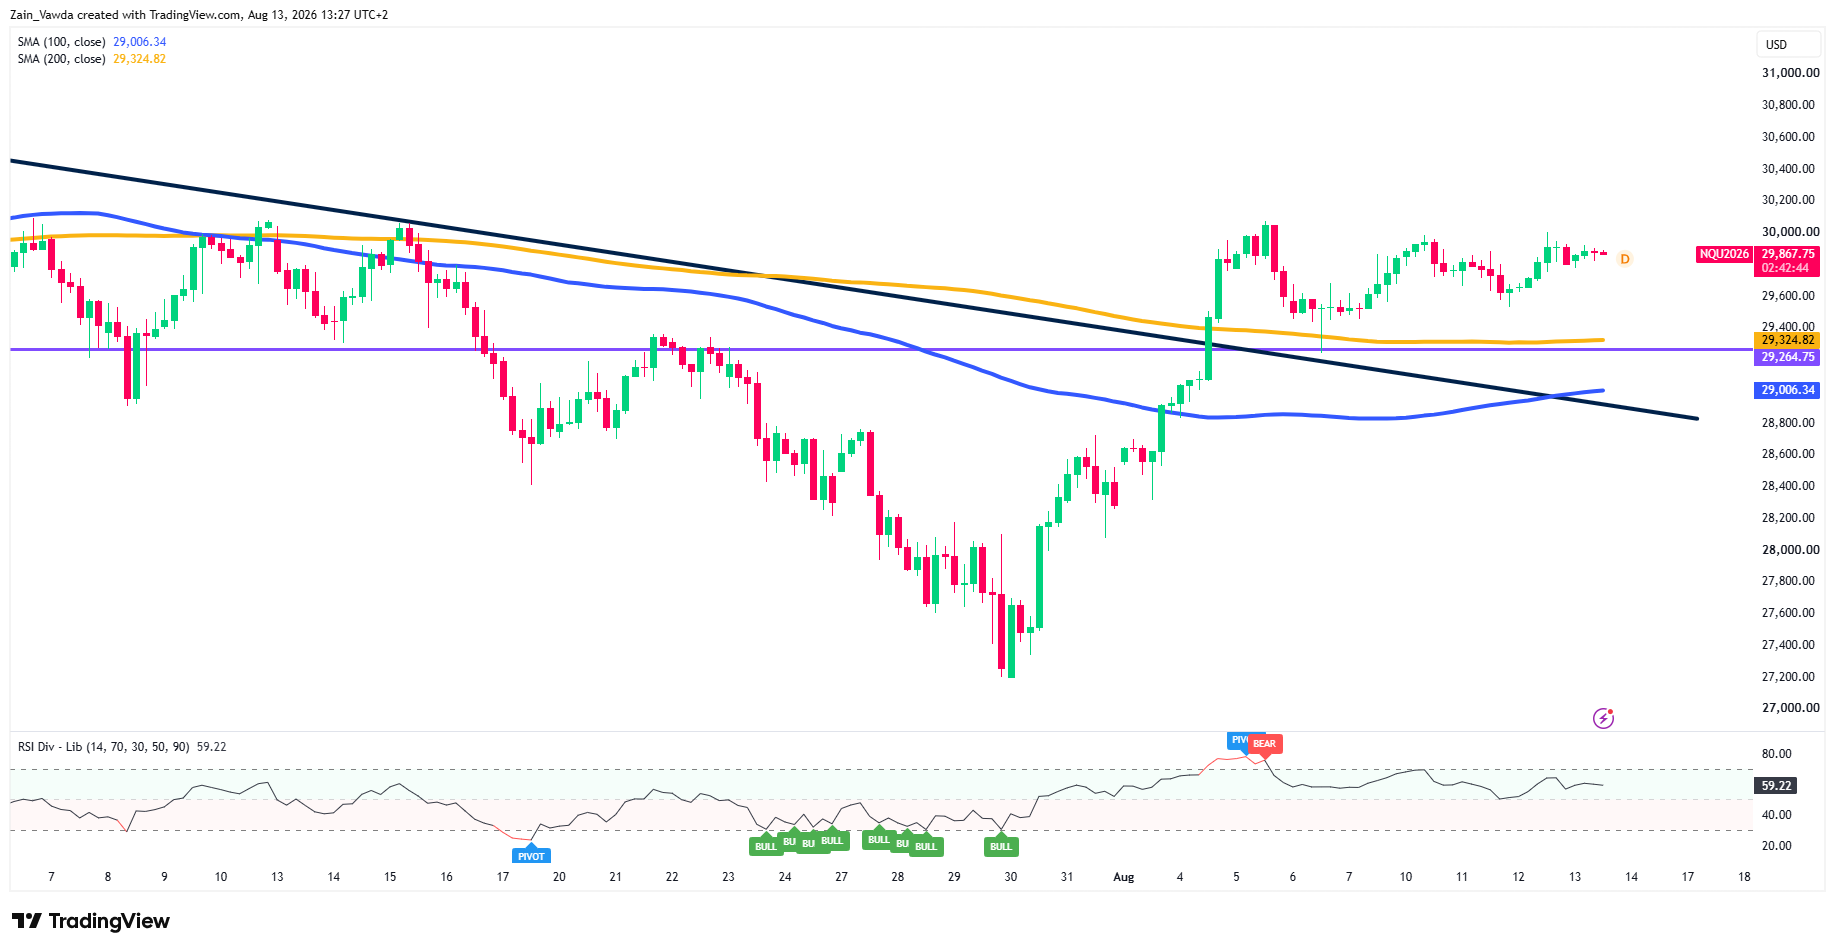
On the H4, NQ (≈29,867) has done real structural work. Price has climbed back above the descending trendline off the early-July high and now trades above both the 100-MA (29,006) and 200-MA (29,325), with the twice-defended 29,264.75 pivot well below as support. RSI near 59, leaves headroom before overbought, though the bearish divergence that tagged the Aug 5–6 high is a reminder that the last push toward 30,000 was sold.
Nasdaq Four-Hour Chart, August 13, 2026
Source: TradingView
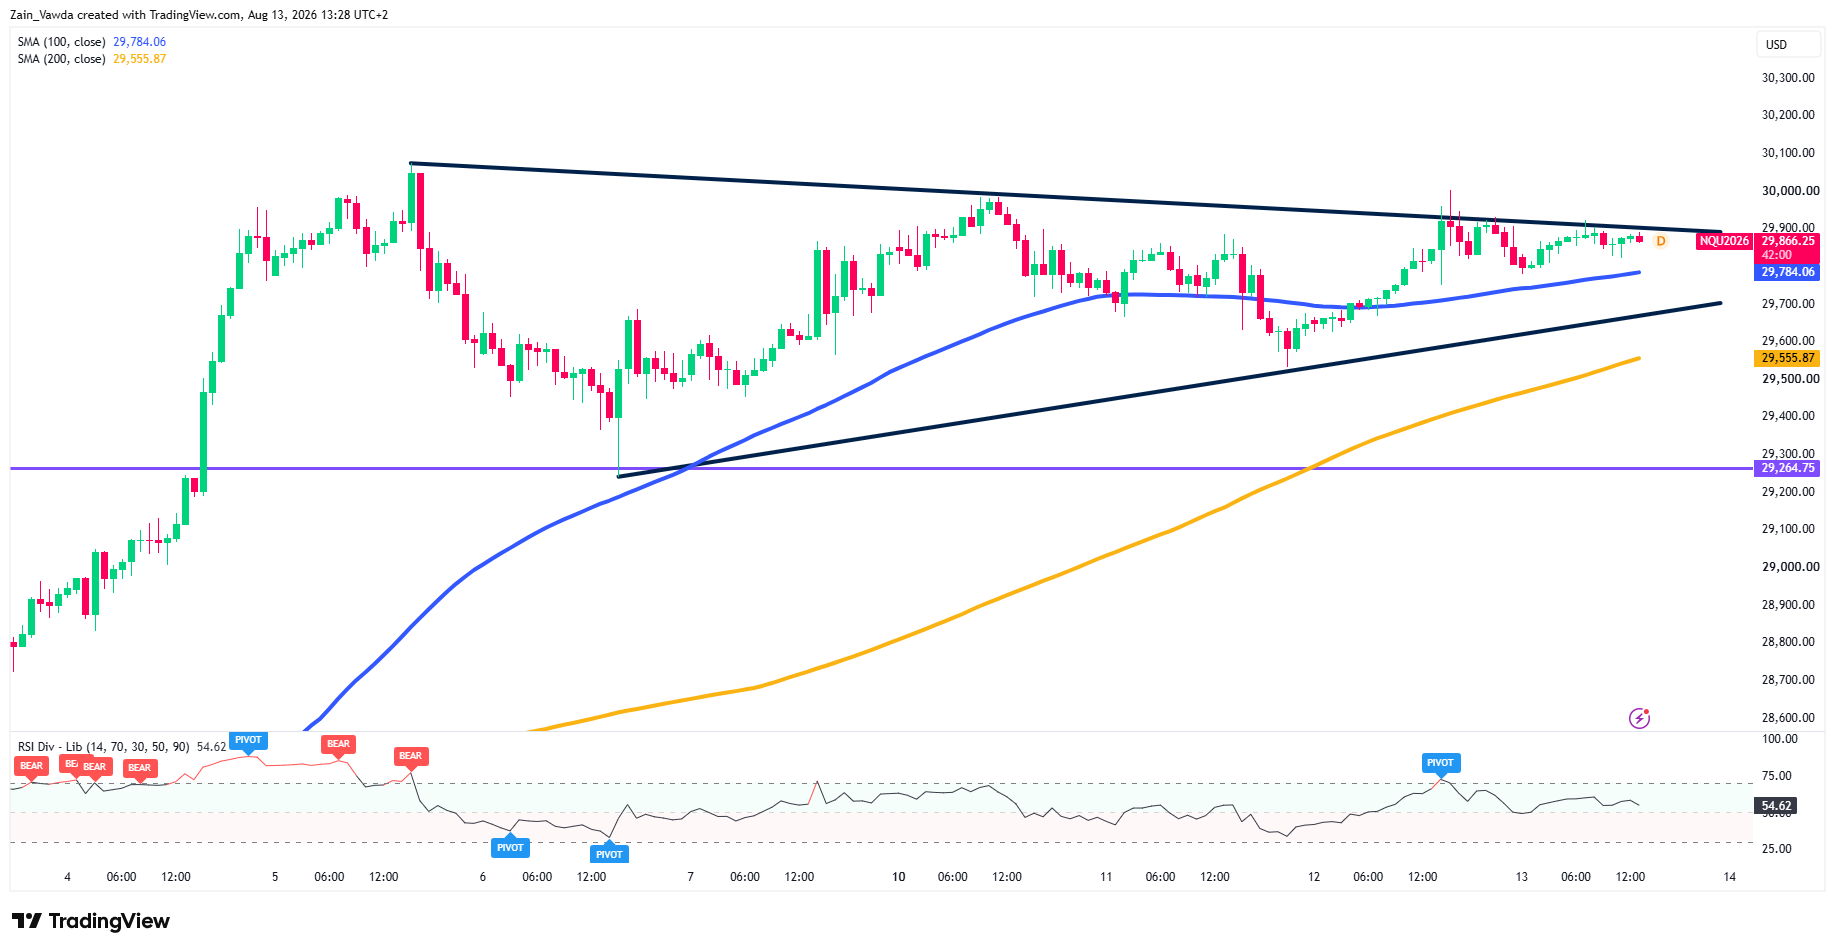
Drop to the H1 and the compression is obvious. A descending line off the Aug 5 high and a rising line off the Aug 6 low have converged into a symmetrical triangle, and price is pressing the upper boundary near 29,900 with the 100-MA (29,784) tucked directly beneath as dynamic support. RSI around 55 is dead neutral, energy stored, not spent.
This is a breakout-pending structure: the apex is close, and the resolution wants a catalyst.
Nasdaq One-Hour Chart, August 13, 2026
Source: TradingView
Dow (YM): Stalled at a Flattening Moving-Average Cluster
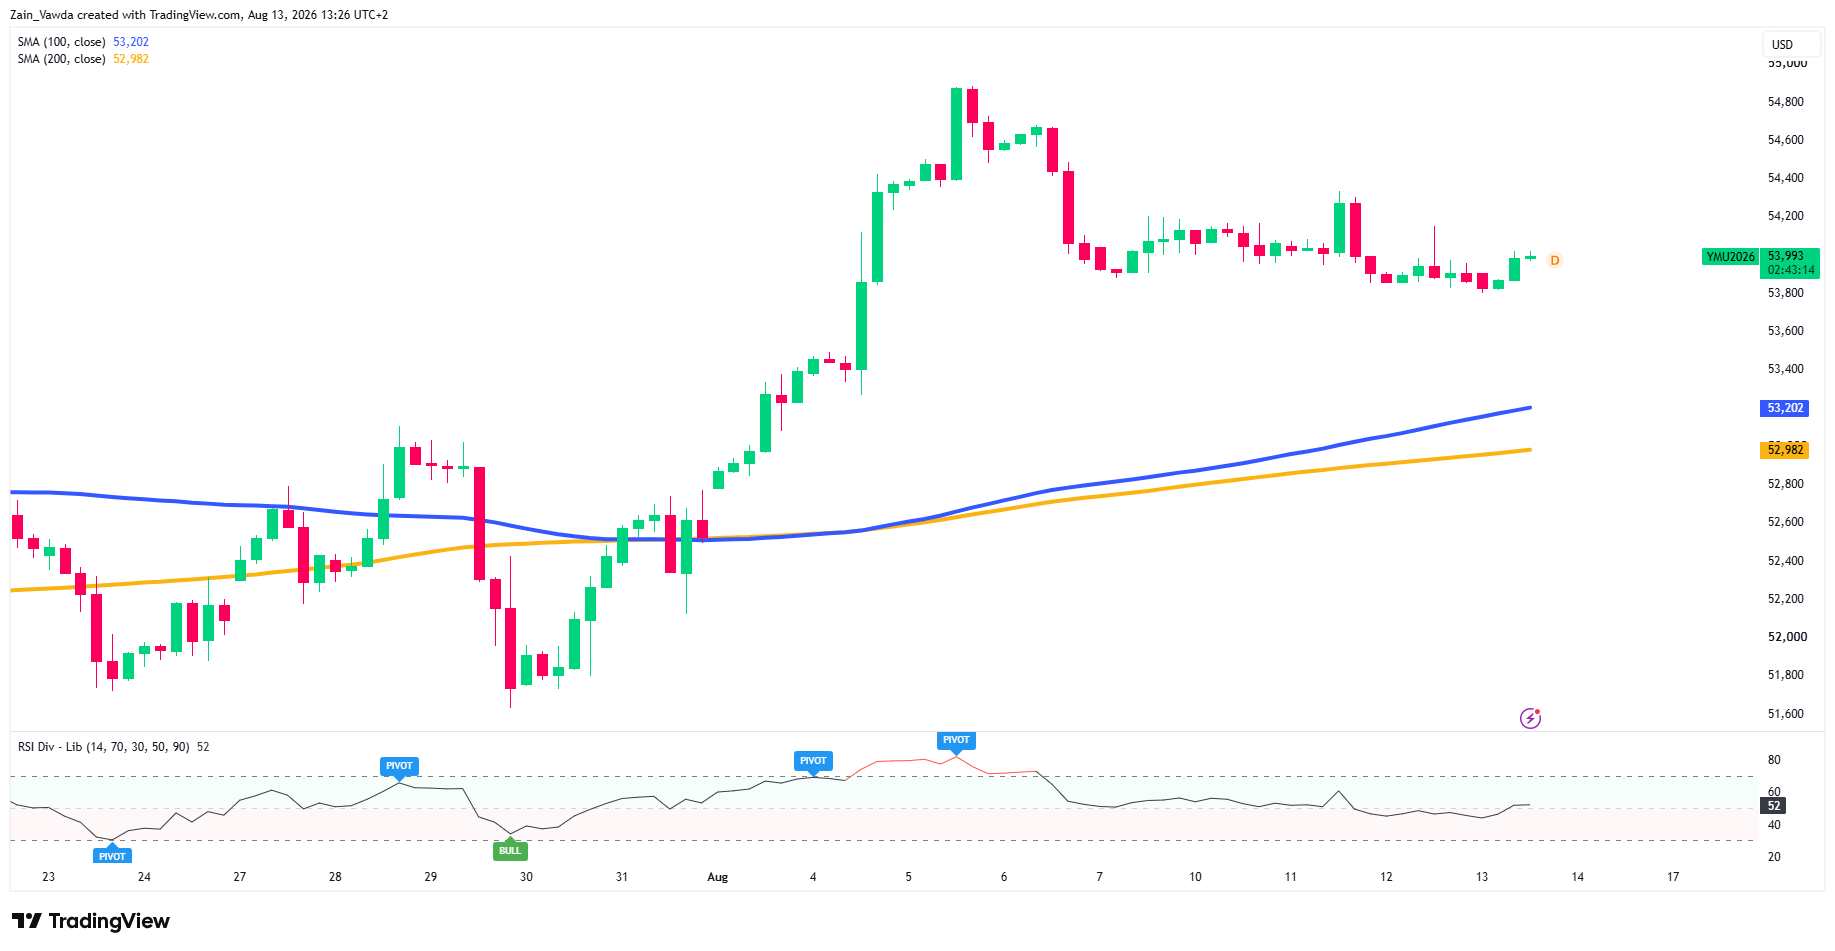
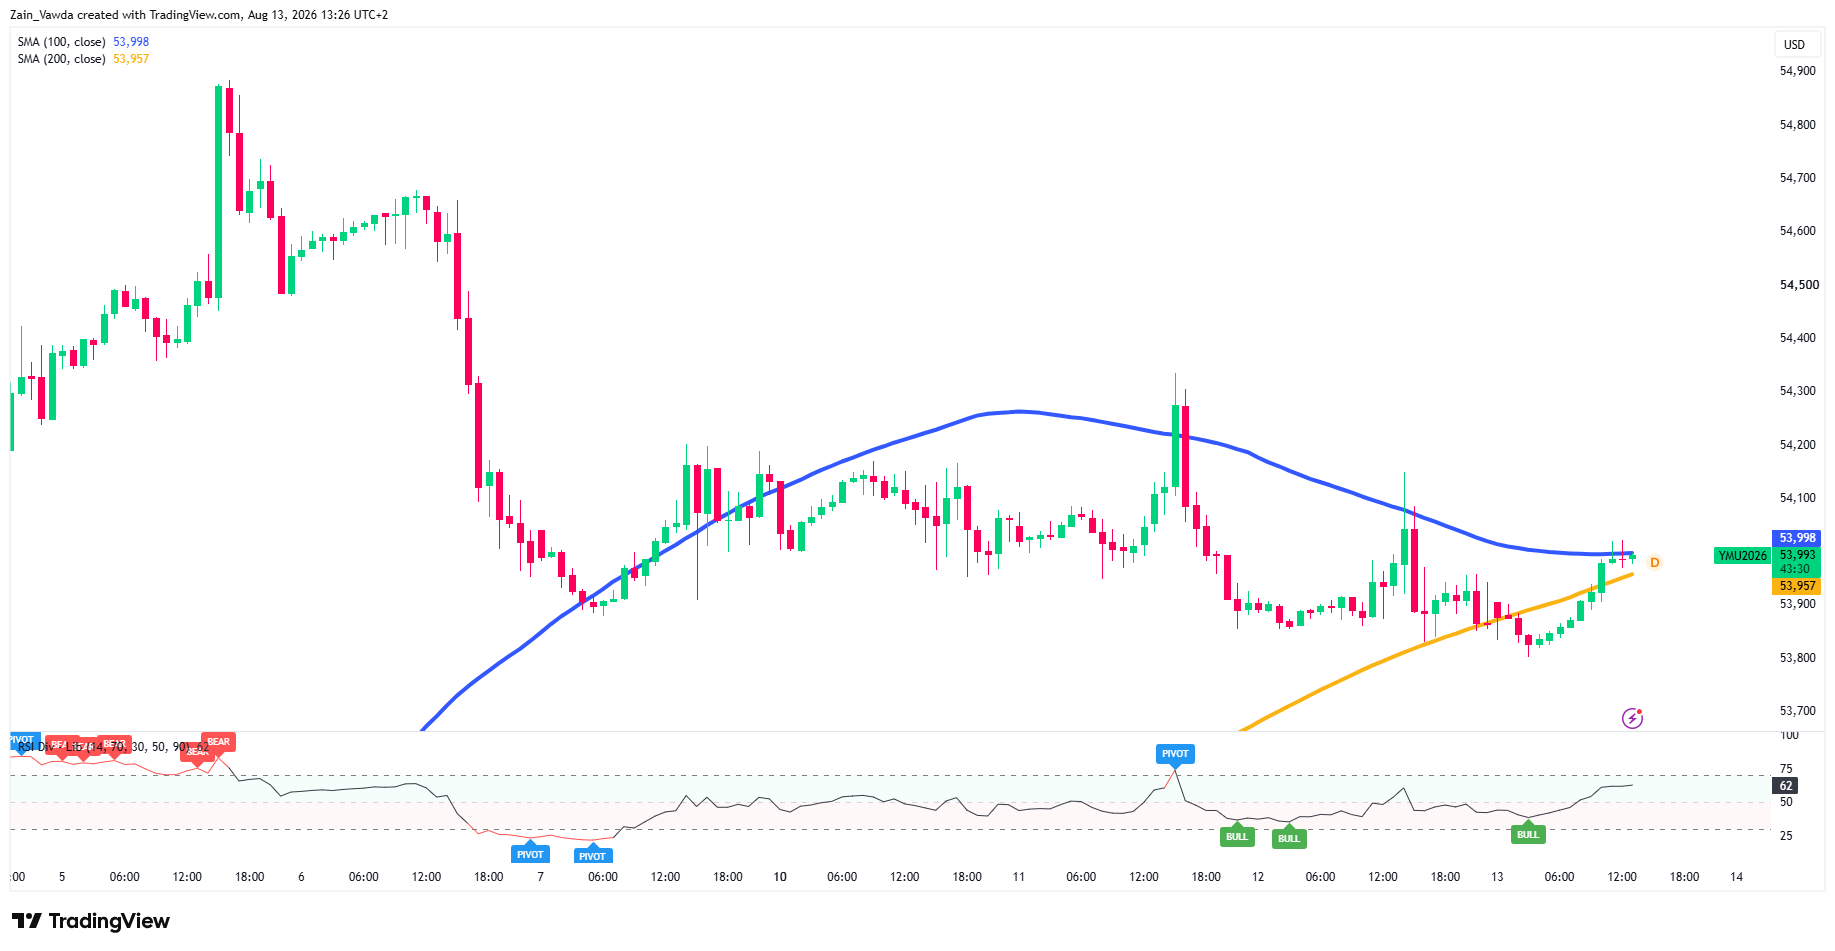
YM (53,993) tells the opposite story. The H4 uptrend off the July 30 low (51,600) to the Aug 5–6 peak (54,900) is intact and price still sits well above its rising 100-MA (53,202) and 200-SMA (52,982), but momentum has bled out. RSI has cooled to 52 and the tape has spent a week chopping sideways between roughly 53,800 and 54,300, unable to retest the highs.
Nasdaq Four-Hour Chart, August 13, 2026
Source: TradingView
The H1 sharpens the problem. The 100- and 200-MAs have flattened and converged into a single band at 53,957–53,998, and price is wrestling right at it. That cluster is the decision line: reclaim it on a close and the 53,800 floor, repeatedly defended, with fresh bullish divergences printing there and becomes a base for another crack at the range top; lose it and the sideways grind tips lower.
Unlike NQ, there is no coil here, just a stall.
Nasdaq One-Hour Chart, August 13, 2026
Source: TradingView
The Dispersion Is the Read
Structure favours NQ; that does not make it a naked long. The two charts frame a pair, not a punt. NQ is the instrument with stored energy and a defined invalidation, lose 29,264.75 and the coil fails.
YM is the one that has to prove it can hold 53,957–53,998 before it earns another leg. And the catalyst is not symmetric: a hot PPI, reviving the September hike tail that CPI just trimmed, lands hardest on the higher-multiple, rate-sensitive Nasdaq, so NQ carries the greater downside beta if the print stings, even as it holds the cleaner upside if it cools. That asymmetry is the trade.
Retail Trader Sentiment - Nasdaq
Based on the data provided by the MarketFramework Positioning Edge Tool, and "Extreme Bullish Divergence" appears to be in play.
Traders use this smart-money sentiment data to establish directional bias. By aligning their entries with historically successful traders rather than the struggling crowd, traders use the divergence as a confirmation signal to favor high-probability long trades.


