Forty-eight hours. That is how long it took Q2 earnings season to travel from triumph to trapdoor.
Big banks opened the cycle earlier this week with solid results, June CPI printed an outright monthly decline, and the setup looked like textbook fuel for equity index futures.
Then Netflix guided soft after Thursday's close, management insisting the long-term growth story is intact despite content timing and sporting-event comparisons and the stock was down more than 8% in Friday's pre-market.
Netflix did recover some of those losses in the US session, trading down around 5.39% ahead of the US session close.
The Tape Is Grading Guidance, Not Results
The tell is not Netflix alone, it is the pattern around it. TSMC posted a sharp jump in quarterly profit that topped expectations on Thursday, and its shares fell anyway, extending a semiconductor rout that took Micron, AMD, Intel and Broadcom down more than 5% each in the prior session.
Samsung's blowout quarter earlier this month met the same reception. When a market sells good numbers, it is telling you the results are no longer the variable. Positioning is full, the AI-capex payoff question is open, and the only new information that clears the bar is forward-looking: guidance, capex framing, and margin trajectory.
Why This Matters for Nasdaq and the S&P 500 Specifically
Index futures traders do not trade Netflix; they trade the narrative Netflix feeds.
NFLX is a top-25 Nasdaq-100 weight, but its real influence this week is as evidence. The 'strong earnings season' framing was doing heavy lifting for NQ at a moment when the macro column — a sixth consecutive night of U.S. strikes on Iran, oil holding around $80, and Fed officials warning sticky inflation could delay easing, offers no support.
Remove the earnings pillar and the index is standing on multiple expansion alone, into a July 29 FOMC where hike risk has been deferred rather than dismissed.
The July 22 Supercluster Could be the Verdict
Next Wednesday compresses the test into a single session: Alphabet, Tesla, Texas Instruments and IBM all report on July 22, alongside GE Vernova, AT&T, ServiceNow and CSX, with the ECB decision following on July 23.
Each name answers a different piece of the question Netflix just posed. Alphabet is the AI-capex ROI referendum. Texas Instruments is the real-economy demand check — analog chips are the tape's early-warning system. IBM tests enterprise software durability, and Tesla tests whether story stocks can still guide their way out of trouble.
If the guidance bar is now the only bar, Wednesday is the largest single collection of bars this month
Potential Scenario Matrix - July 22 Earnings
| Scenario | Trigger - July 22 Earnings Cluster | Nasdaq (NQ), S&P (ES) Reaction |
|---|---|---|
| Bull | Guidance raised across at least three of the four; Alphabet capex framed with revenue attach; TXN book-to-bill firms | Head-fake confirmed as mid-cycle shakeout; NQ reclaims the pre-selloff range, semis squeeze |
| Base | In-line beats, cautious guides; capex sustained but ROI language hedged | Choppy two-way tape; NQ rangebound into the Jul 29 FOMC, guidance premium persists |
| Bear | A second mega-cap guides down or trims AI capex; TXN signals analog demand rollover | Narrative flips from 'strong season' to 'peak spend'; NQ retests the weekly low, ES follows |
Retail Trader Sentiment
The Positioning Edge tool is telling a sharper story than the price action. In ES the tool is flashing an extreme bearish divergence: profitable traders are just 33% long against 56% for unprofitable accounts. The smart-money side of the book is pressing the downside in the broad index.
NQ is the twist. Despite the far uglier tape, the tool reads a mild bullish divergence — profitable traders are 55% long, four points more long than the unprofitable cohort at 51%.
Into the July 22 report cluster, this divergence map is the cleanest live read on how the guidance repricing is actually being traded — keep an eye on it using the positioning edge tool on MarketFramework.
S&P 500 Technical Outlook
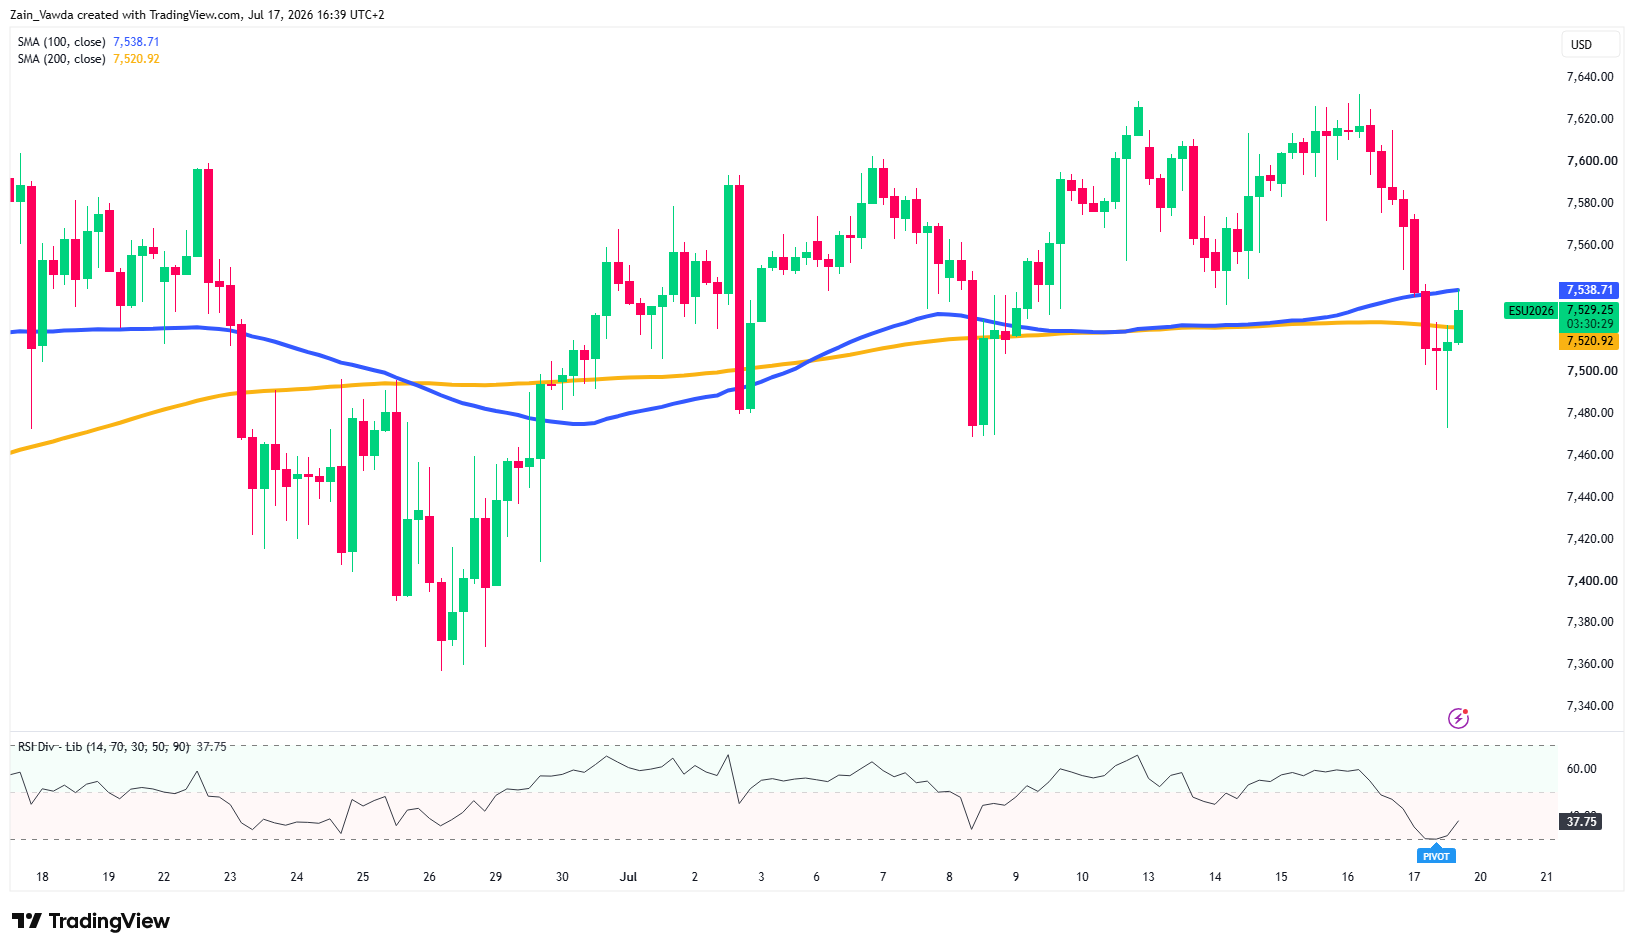
S&P 500 futures trade at 7,500 after a sharp two-day slide from the 7,620–7,630 supply zone, where price has been rejected three times since July 10.
S&P 500 (ES) Futures Four-Hour Chart, July 17, 2026
Source: TradingView
The selloff pierced both the 100-day MA (7,538) and 200-day MA (7,521) before buyers defended the 7,470 area with a long lower wick — a tentative reversal signal.
Price is now squeezed between the converging moving averages, making this cluster the immediate battleground.
RSI at 37.75 is recovering from near-oversold with a pivot flag, hinting at short-term stabilization.
A 4H close back above 7,540 targets 7,580, then the range highs; failure to reclaim the SMAs keeps sellers in control, exposing 7,470 and 7,440 below.


