
Two of the biggest equity futures contracts head into Friday’s July payrolls at opposite ends of the technical spectrum. The S&P 500 E-mini (ES) has broken its June–July range to a fresh record and is merely catching its breath.
The Nasdaq E-mini (NQ) is still repairing a deeper drawdown, wedged beneath the downtrend line off its June high. That relative-strength split is the story — and the payroll print is what resolves it.
For the fundamental setup, the July NFP preview frames consensus at roughly +88K, a 4.2% jobless rate and +0.3% on average hourly earnings — a “cooling but not cracking” labor market.
S&P 500 (ES) — Breakout, Then a Breather
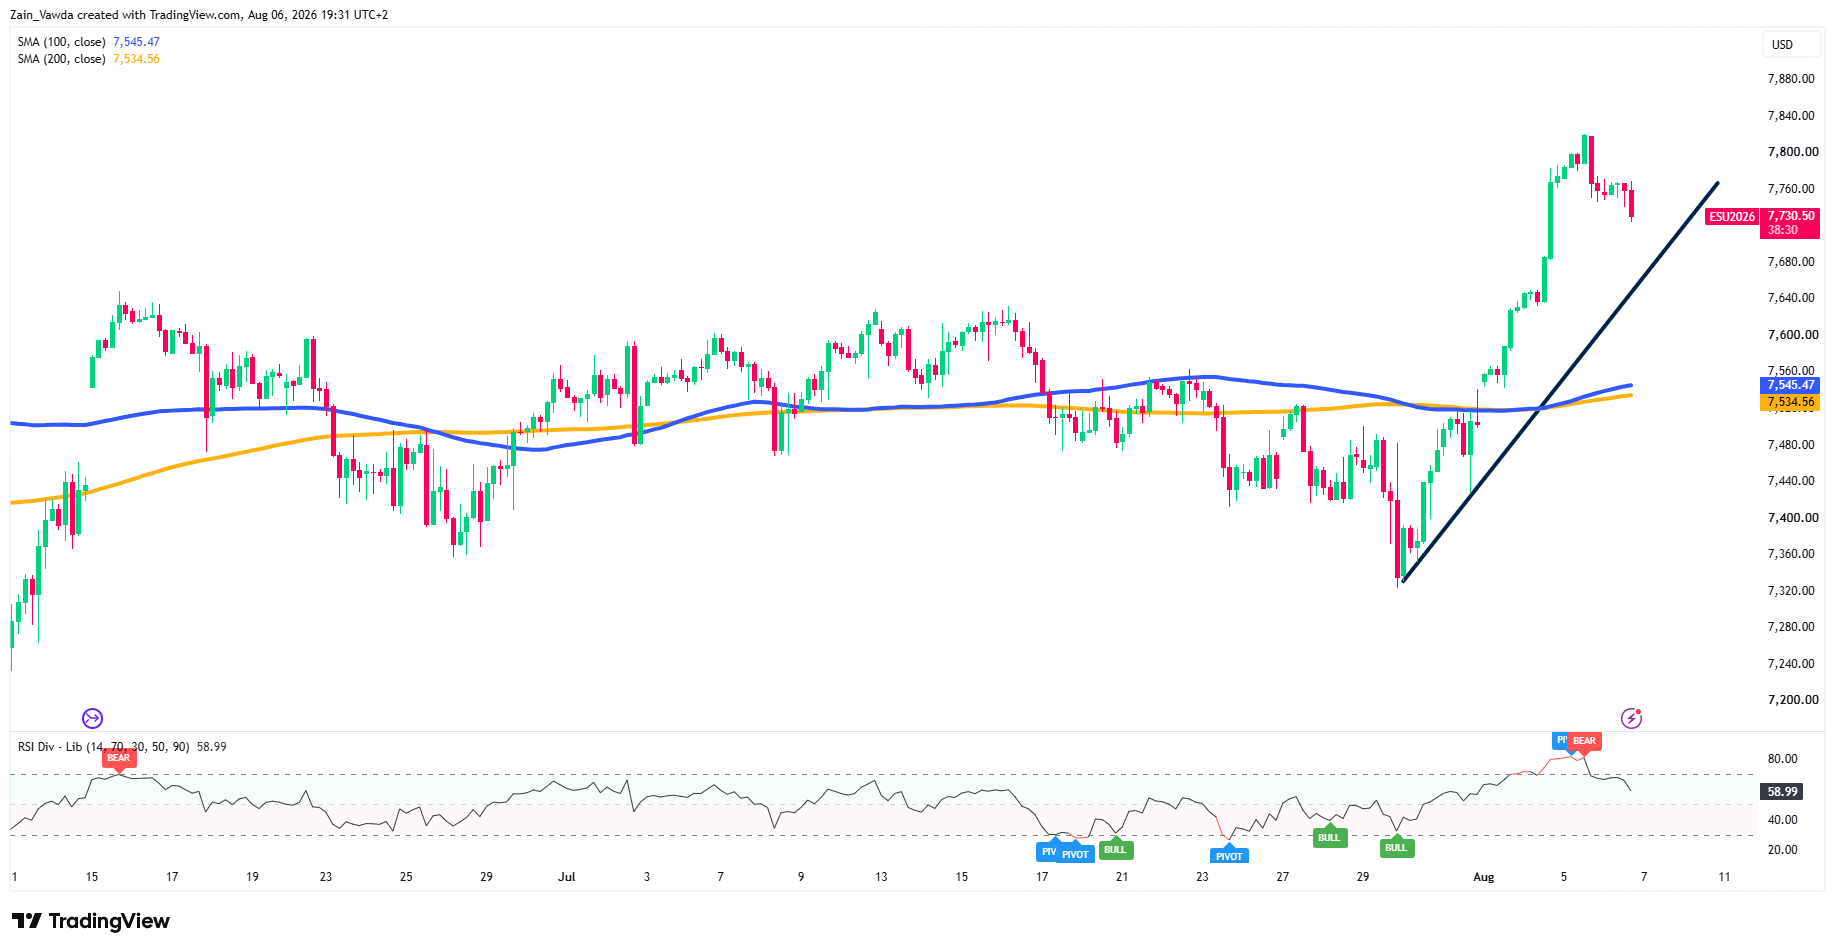
On the H4, ES is in a clean uptrend. Price cleared the 7,400–7,640 congestion that boxed it through June and July and printed a record near 7,840 on Aug 5, riding a rising trendline off the Jul-30 swing low at ~7,320. The 100- and 200-period MAs sit stacked and nearly overlapping around 7,540, well beneath spot — textbook trend support.
RSI at ~59 is easing off a bearish divergence tagged at the highs, which reads as a breather, not a break.
S&P 500 Four-Hour Chart, August 6, 2026
Source: TradingView
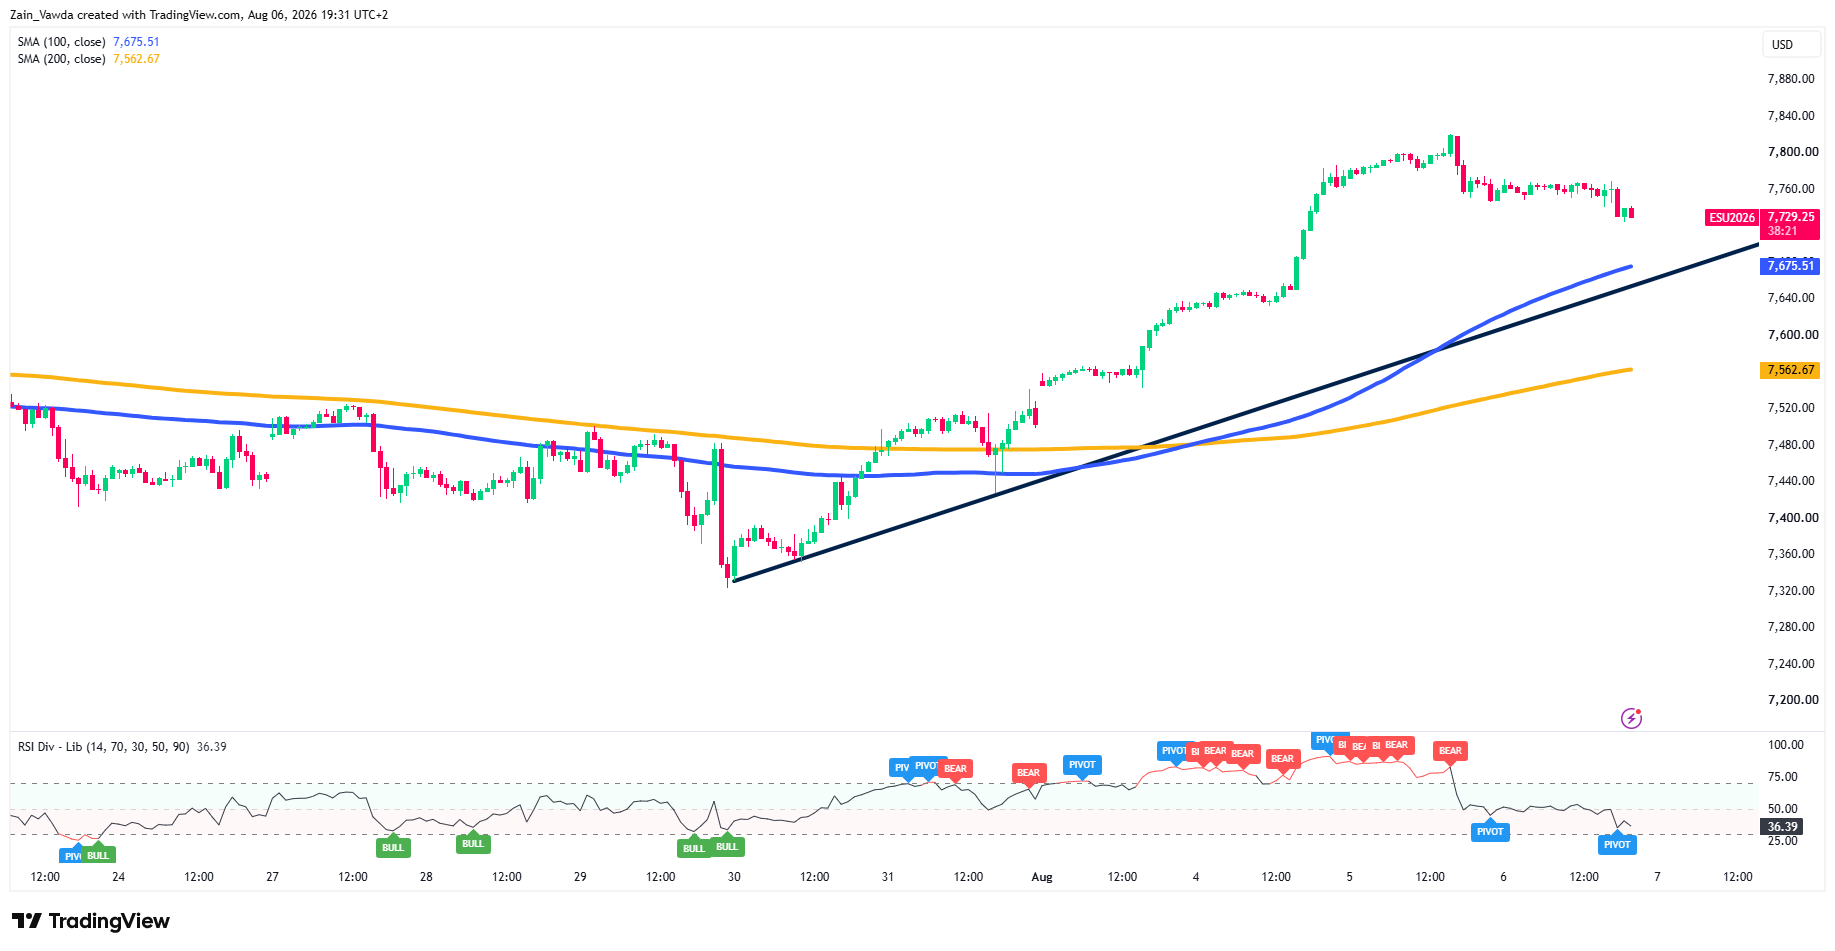
Drop to the H1 and the pullback is more visible: the flush has cooled RSI to ~36 with a fresh pivot, the kind of near-term washout that tends to precede a bounce inside a trend. Price is testing the 7,675 shelf (the H1 100-MA), with the rising trendline near 7,600 and the 7,540–7,562 MA cluster below as the line that keeps the bias constructive.
While ES holds that trendline, dips are buyable and 7,840 stays the upside magnet.
S&P 500 One-Hour Chart, August 6, 2026
Source: TradingView
Nasdaq (NQ) — Still Repairing the June Break
NQ tells a rougher story.
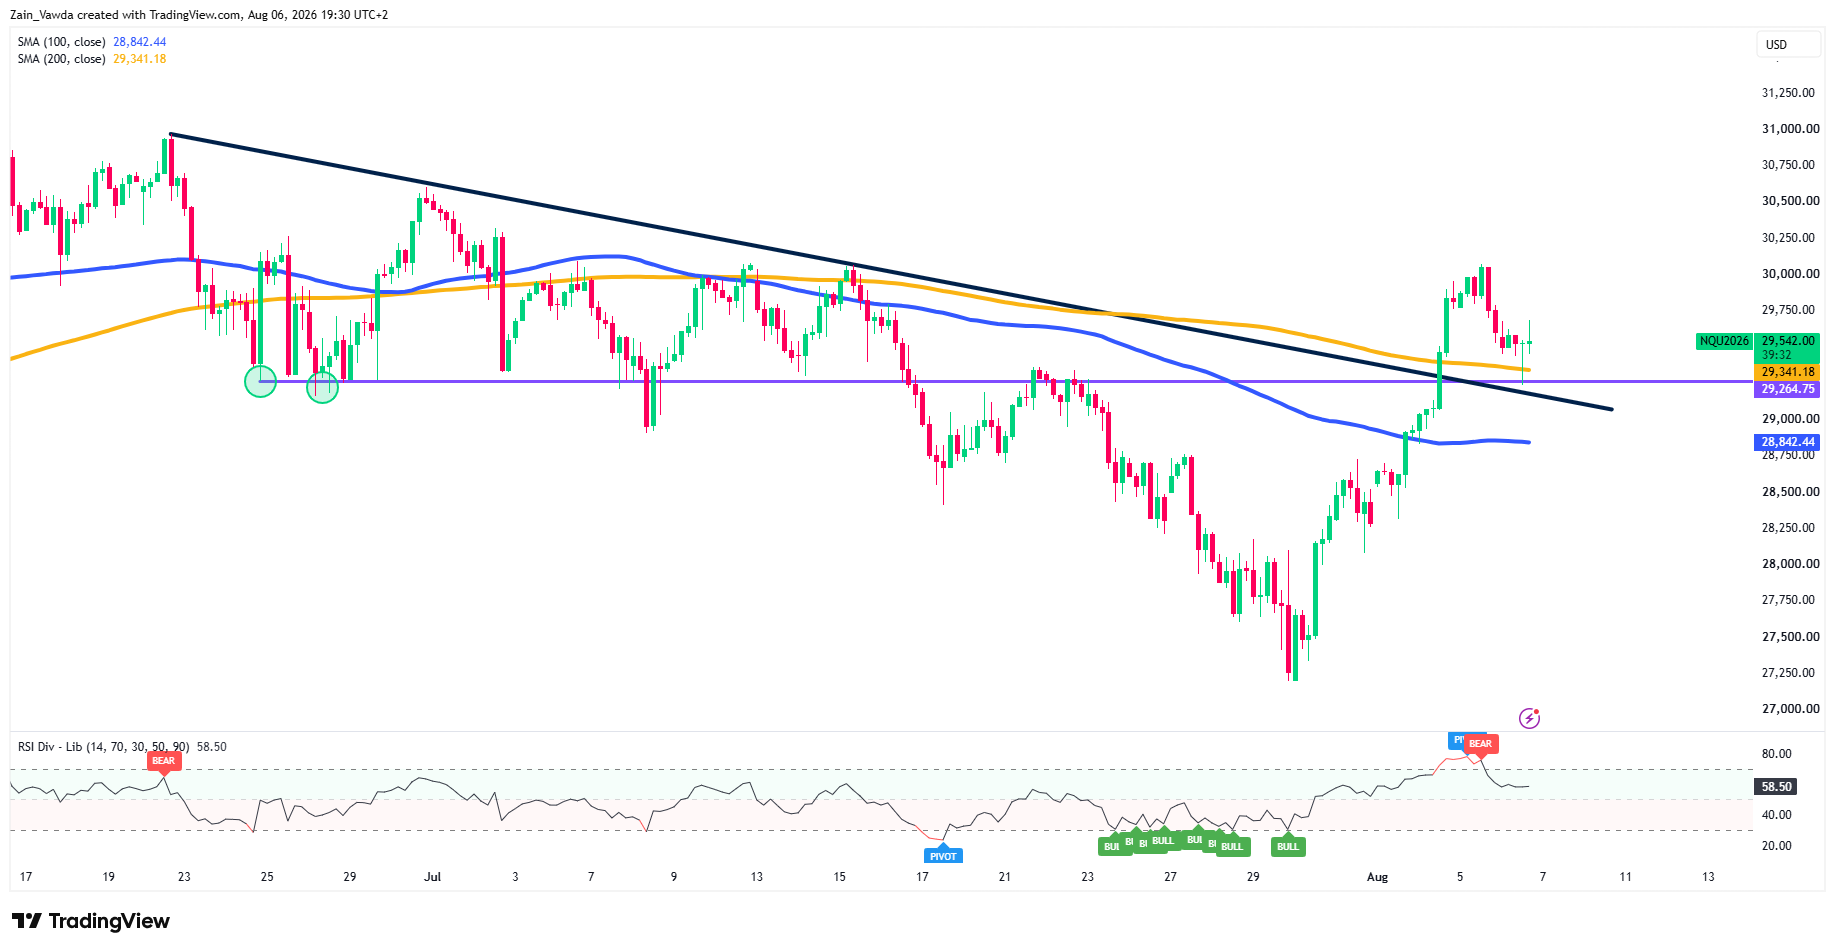
The H4 shows a full round-trip: down from ~31,000 in June to ~27,250 in late July, then a V-recovery back to ~30,050 on Aug 5. The catch is where price sits now — back at the descending trendline off the June high, with the 200-MA (29,341) capping just overhead and the 29,264.75 pivot (the purple line, twice defended in June) plus the 100-MA (28,842) beneath.
Note the MA structure hasn’t confirmed bullish: the 200 still sits above the 100. Price has reclaimed both, but this is a retest of resistance, not a clean breakout.
Nasdaq (NQ) Four-Hour Chart, August 6, 2026
Source: TradingView
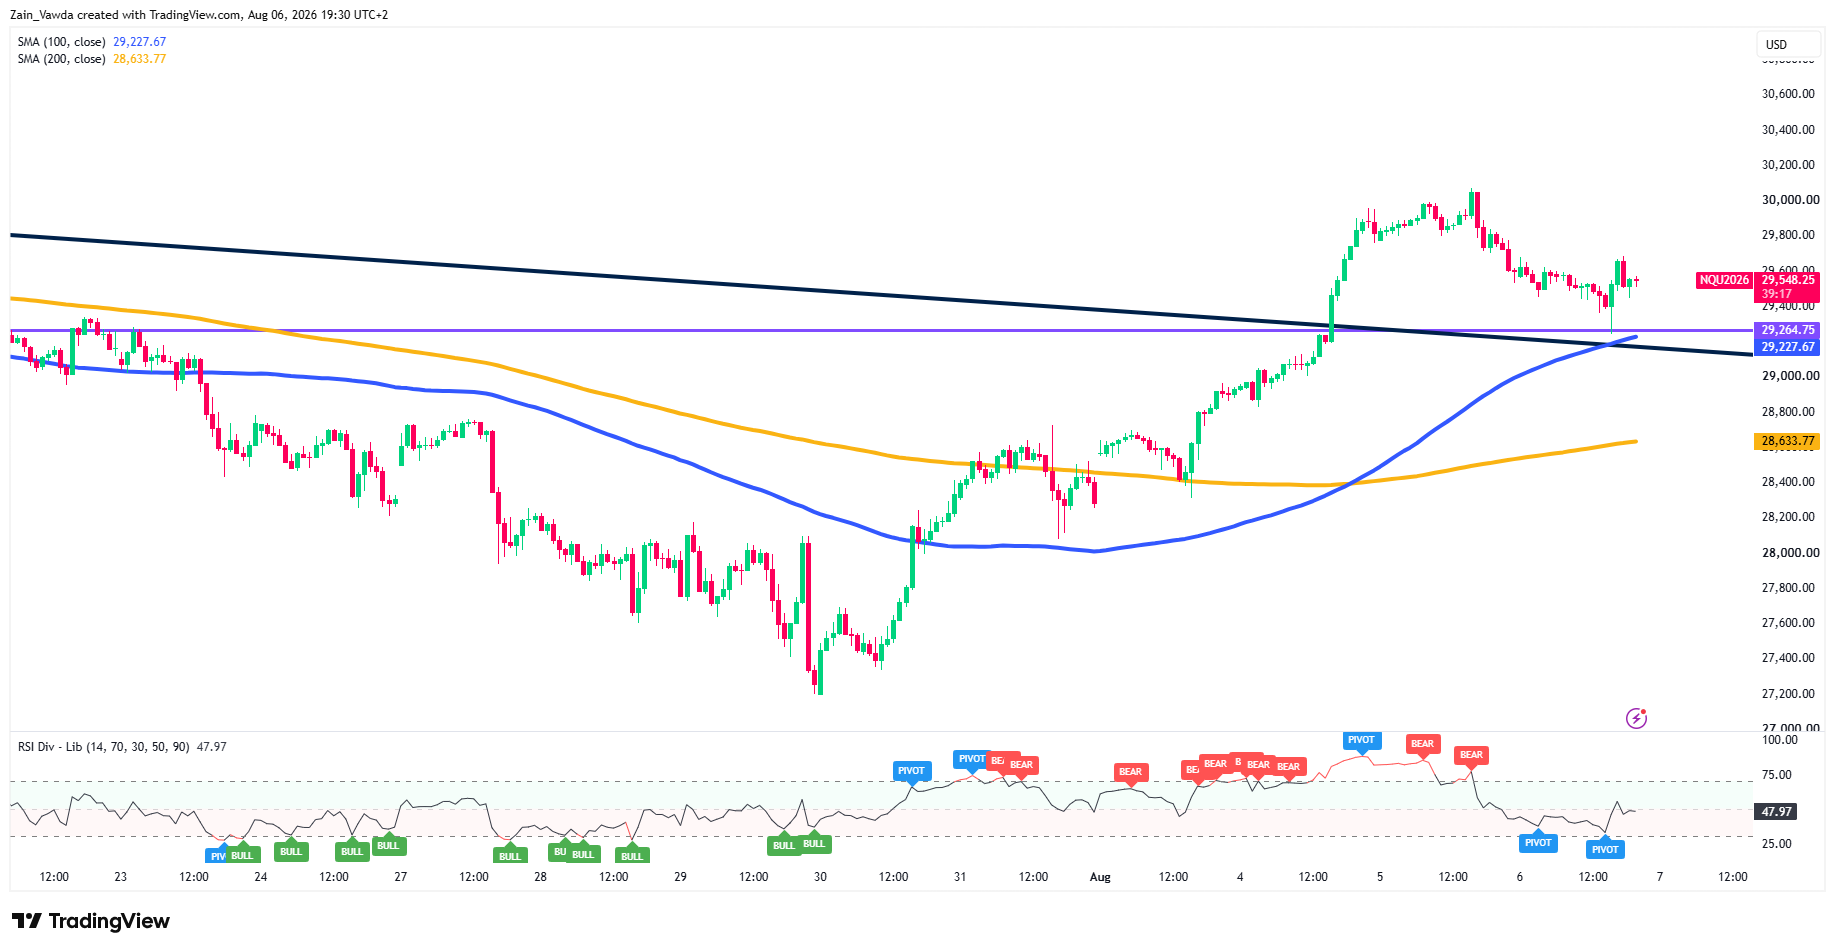
The H1 sharpens it: NQ is pinned between the same downtrend line above and the 29,264 pivot / 29,227 H1 100-MA below, with RSI at ~48 rolling over off its own bearish divergence. This is a coil at resistance. NQ needs to hold 29,264 and clear the 29,750 lower high — ideally 30,050 — to turn genuinely constructive; lose the pivot and the 100-MA, and the path opens toward 28,842 and the late-July base.
Nasdaq (NQ) One-Hour Chart, August 6, 2026
Source: TradingView
How the Print Splits Them
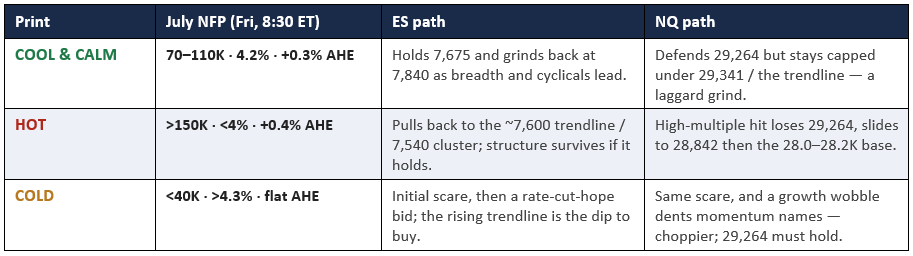
The scenario map and the charts point the same direction. A hot number — north of 150K with a sub-4% jobless rate and hotter earnings — revives September hike odds and spikes yields, and that lands hardest on tech and high-multiple growth.
That is NQ’s problem, not ES’s: the Nasdaq carries more downside beta to a hawkish surprise and it is already sitting on its pivot. A base-case print keeps the pause intact and rewards breadth and cyclicals — which is where ES’s leadership lives.
Even the dovish tail cuts unevenly: an initial risk-off scare can give way to a rate-cut bid for the broad index, while a growth wobble tends to chop the momentum names NQ leans on.
Watch average hourly earnings as the swing factor — a soft headline with hot wages can still bid yields and cap both.
Scenario Matrix — Nearest Catalyst: July NFP, Friday, Aug 7 (8:30 ET)
Source: TradingView
The Bottom Line
ES leads, NQ lags, and both are coiled at decision points into the print. The technical bias and the fundamental asymmetry agree: strength favors the S&P, and the hawkish tail hurts the Nasdaq more.
Two lines define Friday’s equity tape — ES’s rising trendline near 7,600 and NQ’s 29,264 pivot.
Hold both and the two-speed tape grinds higher together; break them and the Nasdaq leads the way down. The jobs number picks the door.
Retail Trader Positioning
Trader positioning data provides clear visibility into overall market sentiment. By highlighting where capital is allocated, it helps traders spot overcrowded positions, identify powerful contrarian signals, and better time market entries while managing risk more effectively.
Keep up to date with the latest retail trader positioning data using the Positioning Edge Tool on MarketFramework.


