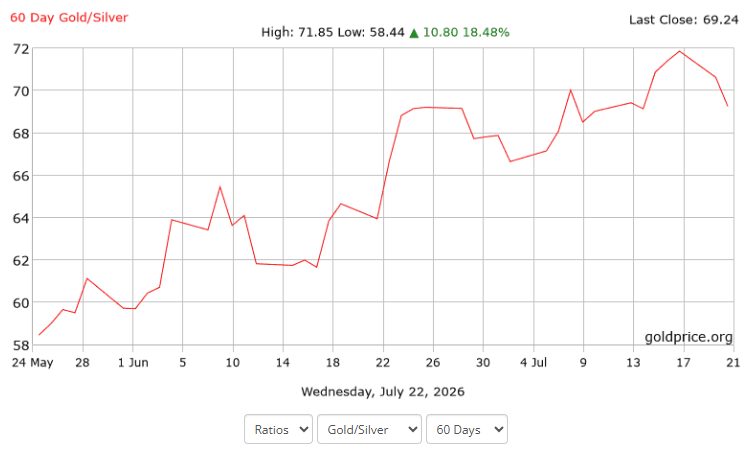
Silver just did something it has not managed in two months: it out-ran gold. On July 21 the metal jumped roughly 3.5% to about $59 while gold added only 1.5%, dragging the gold–silver ratio below 70 to near 68.7 from above 70.7 the prior session.
For a futures trader, that compression, not the headline dollar move is the signal worth trading.
The catch: it is a rebound off a violent correction, and next week’s FOMC decides whether it holds.
A Compression, Not a Breakout
Context matters here. The ratio had widened from about 55:1 in May to roughly 69:1 by mid-July as the hawkish Fed repricing punished silver harder than gold. Tuesday’s move is silver clawing leadership back, not a fresh bull leg firing. Remember the tape it is climbing out of: a record $121.62 on January 29 collapsed to around $58 by late June — the metal roughly halved.
The break below 70 is early evidence of relative-value rotation, and history says levels near the top of the 50-year 60:1–70:1 band have preceded silver outperformance. It is a valuation signal, not a forecast.
Source: Goldprice.org
The structural bid is the robust part
The supply story has not wavered through the correction. The Silver Institute’s 2026 World Silver Survey confirmed a sixth consecutive annual deficit at 46.3 million ounces, and cumulative above-ground drawdowns since 2021 have reached roughly 762 million ounces — close to nine months of global mine supply absorbed by industrial and investment demand.
Shanghai Futures Exchange warehouse stocks have thinned to about 715 tonnes, among the lowest on record. With industrial use near 58% of consumption, the relative-value math is stark: on a ~$4,049 gold print, a move to 65:1 implies silver near $62.30 and a return to 55:1 implies $73.60. Institutional targets sit well above spot — the LBMA 2026 consensus at $79.57 and JPMorgan’s base case at $81.
Analysts revised the path, not the destination.
The Bear Counter — Don’t Skip It
The other side is technical and cyclical, and it is live.
On the charts, silver’s advance reads to several desks as a corrective bounce inside an intact downtrend — lower highs, lower lows — with objectives still at $54 and $50. And silver’s dual nature cuts both ways: it runs on a monetary engine and an industrial one, so when September rate-hike odds sit elevated, industrial-demand expectations stay suppressed and silver absorbs hits gold shrugs off. That is precisely what drove July’s underperformance.
The same catalyst powers both scenarios.
The FOMC is the Referee
June CPI cooling to 3.5% from May’s 4.2% was silver-positive and helped this bounce. Now the July 28–29 meeting resolves the real-yield question the whole spread hinges on: a neutral-to-dovish hold eases pressure and fuels the compression; a hawkish hold that keeps September alive re-widens the ratio.
Trade the SI–GC spread rather than outright longs to isolate the relative-value view from the messier directional call on yields.
Possible Scenarios Moving Forward
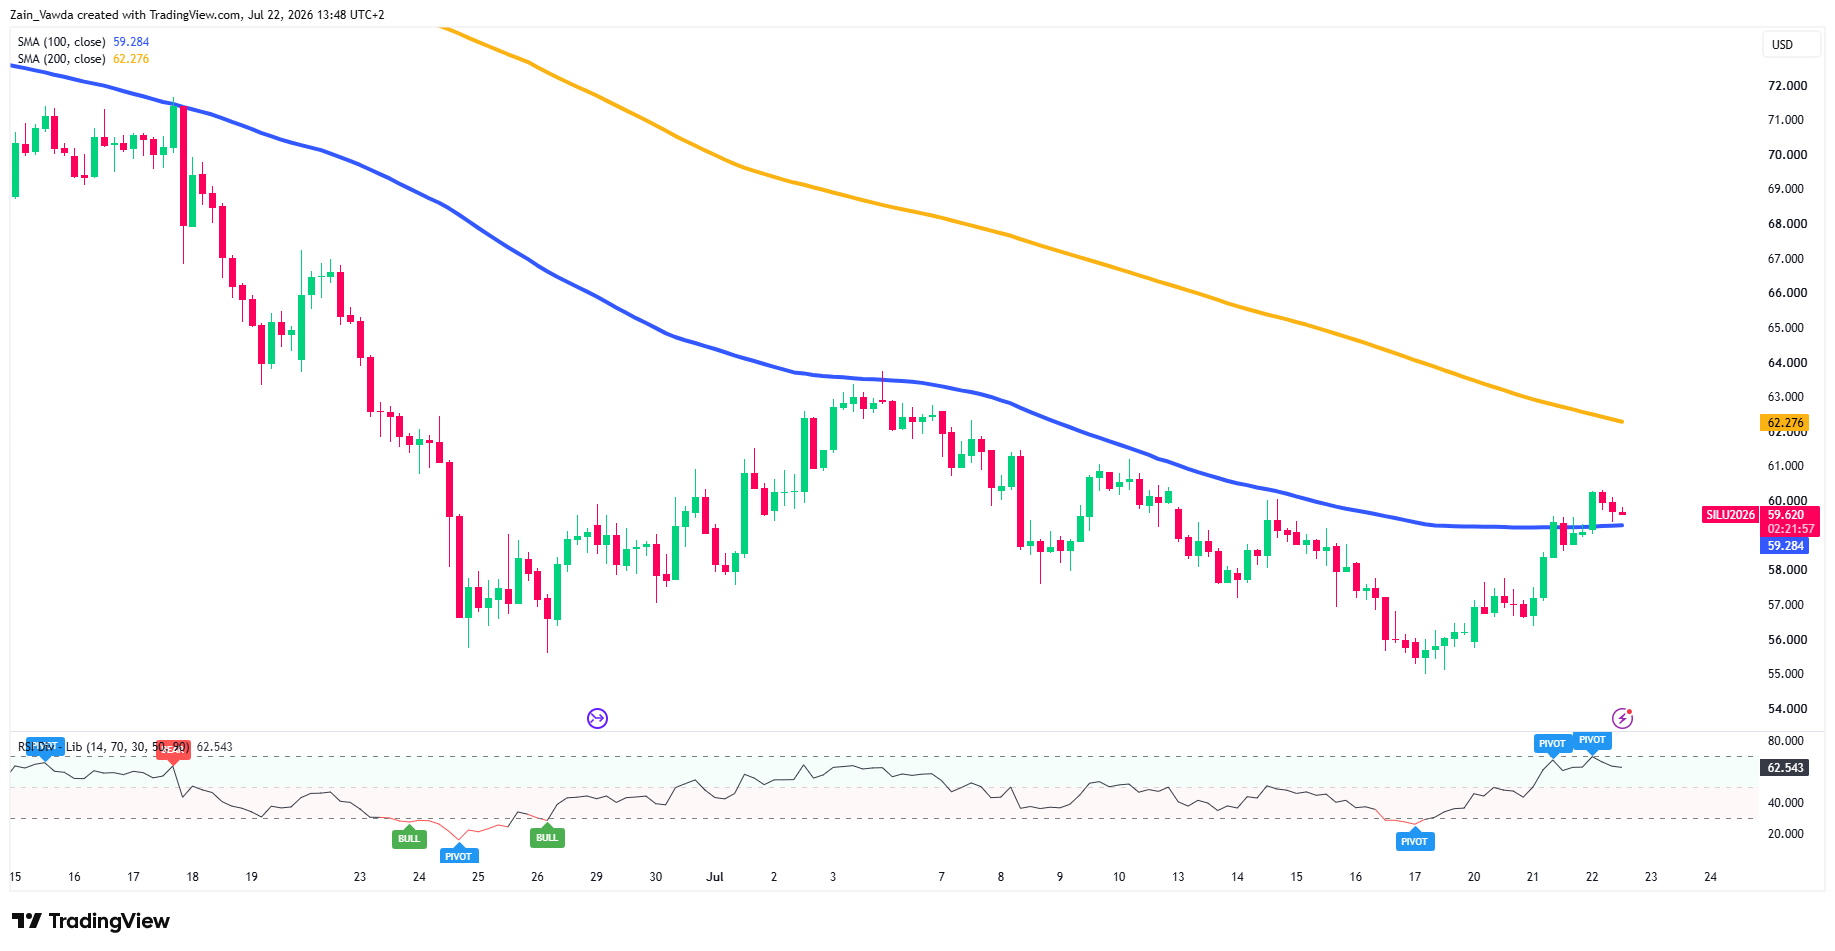
Silver Futures Four-Hour Chart, July 22, 2026
Source: TradingView
Silver is testing the 100-SMA (59.284) after breaking above earlier on in Wednesdays session. The rally off the July 17 low near 55.00 — flagged by a bullish RSI pivot — has now broken above the 100-MA, the level that has defined this downtrend.
RSI at 62.543 has pushed to the top of its range with successive pivot highs, showing momentum behind the bounce but nearing stretched territory.
The 100-SMA is the line in the sand. A clean 4H push above 59.28 opens the descending 200-SMA at 62.276. Rejection here keeps the broader downtrend intact and puts 58.00, then 57.00, back in focus.
Ready to dominate your market? Uncover your unique competitive advantage and refine your strategy with the Positioning Edge tool today.


