Brent crude futures are trading near $90 per barrel on Tuesday, consolidating after a sharp 6% surge on the first trading day of June, which briefly pushed WTI above $92 per barrel.
The driver remains the same story that has dominated energy markets for months: the US-Iran conflict and the de facto closure of the Strait of Hormuz. Iranian media reported that Tehran had suspended communications with Washington in response to Israeli strikes in Lebanon, with Iran and its regional allies weighing a full closure of the Strait of Hormuz and the Bab el-Mandeb Strait, a critical alternative shipping route.
With the narrative largely the same let us take a look at the CoT data and what it tells us.
COT Snapshot — Week to May 26, 2026 (Released May 29)
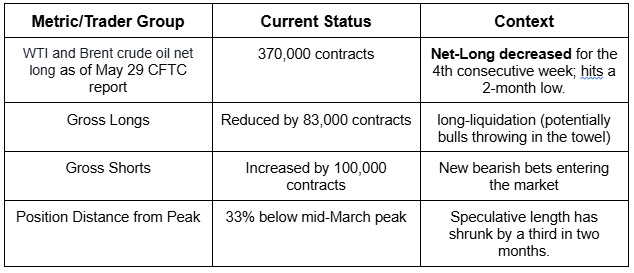
The CFTC Commitments of Traders (COT) data released last Friday (which captures market positions up to the close of Tuesday, May 26) shows a massive structural shift in the energy sector.
Speculators are aggressively abandoning the long side of the trade as geopolitics pivot. Here is the raw data breakdown for Crude Oil (combined WTI and Brent), followed by an analysis of what this means for the market moving forward.
For context, aggregate net-long positioning across WTI and Brent contracts retreated for the fourth straight week, collapsing to its lowest point in two months.
Raw Analysis of CoT Data
Source: CoT Data from CFTC, SAXO Bank.
Table Created by Zain Vawda
Is the CoT Data a Sign of Profit Taking or a Structural Shift?
In a typical minor market correction, you will see Long Liquidation (bulls selling out to book profits), but Gross Shorts will remain flat.
The May 29 data shows a double-whammy:
- Gross longs fell by 83,000 contracts.
- Gross shorts surged by 100,000 contracts.
This could be the market telling us that institutional money isn't just taking profits; they are actively fading the market and positioning for a deeper cyclical downturn. Money managers are aggressively shifting from "buy the dip" to "sell the rally."
On the flip side, the energy market is quickly fixing its issue of being "overcrowded" with buyers, as the number of contracts on rising prices has dropped by a third since around Mid-March 2026.
However, a new risk may be taking its place.
Traders added 100,000 new short contracts in a single week (CFTC report May 29), creating the perfect setup for a sudden, aggressive price jump known as a short-squeeze.
If upcoming peace talks suddenly fail or if physical supply problems return, these betting sellers will be forced to rush and buy back their contracts to avoid massive losses. This panic-buying could spark a rapid and explosive rally in energy prices.
OPEC+ Watch — June 7 Meeting in Focus
Seven OPEC+ members including Saudi Arabia, Russia, Iraq, Kuwait, Kazakhstan, Algeria, and Oman have agreed on May 3 to implement a production increase of 188,000 barrels per day effective June 2026, continuing the gradual unwinding of the April 2023 voluntary cuts.
Saudi Arabia and Russia each took the largest June share at 62,000 bpd, targeting 10.291 million and 9.762 million bpd respectively.
The alliance has made clear that the rollback can be paused, reversed, or accelerated depending on market conditions and constraints stemming from the Iran war.
The next key event is the full ministerial meeting on June 7, which will be closely watched for any signal on whether the group pivots in light of current price levels or doubles down on its unwinding path.
There is no obvious pressure to reverse course but given the geopolitical uncertainty overhanging supply, few expect OPEC+ to be anything other than cautious.
Near Term Outlook for Oil Prices
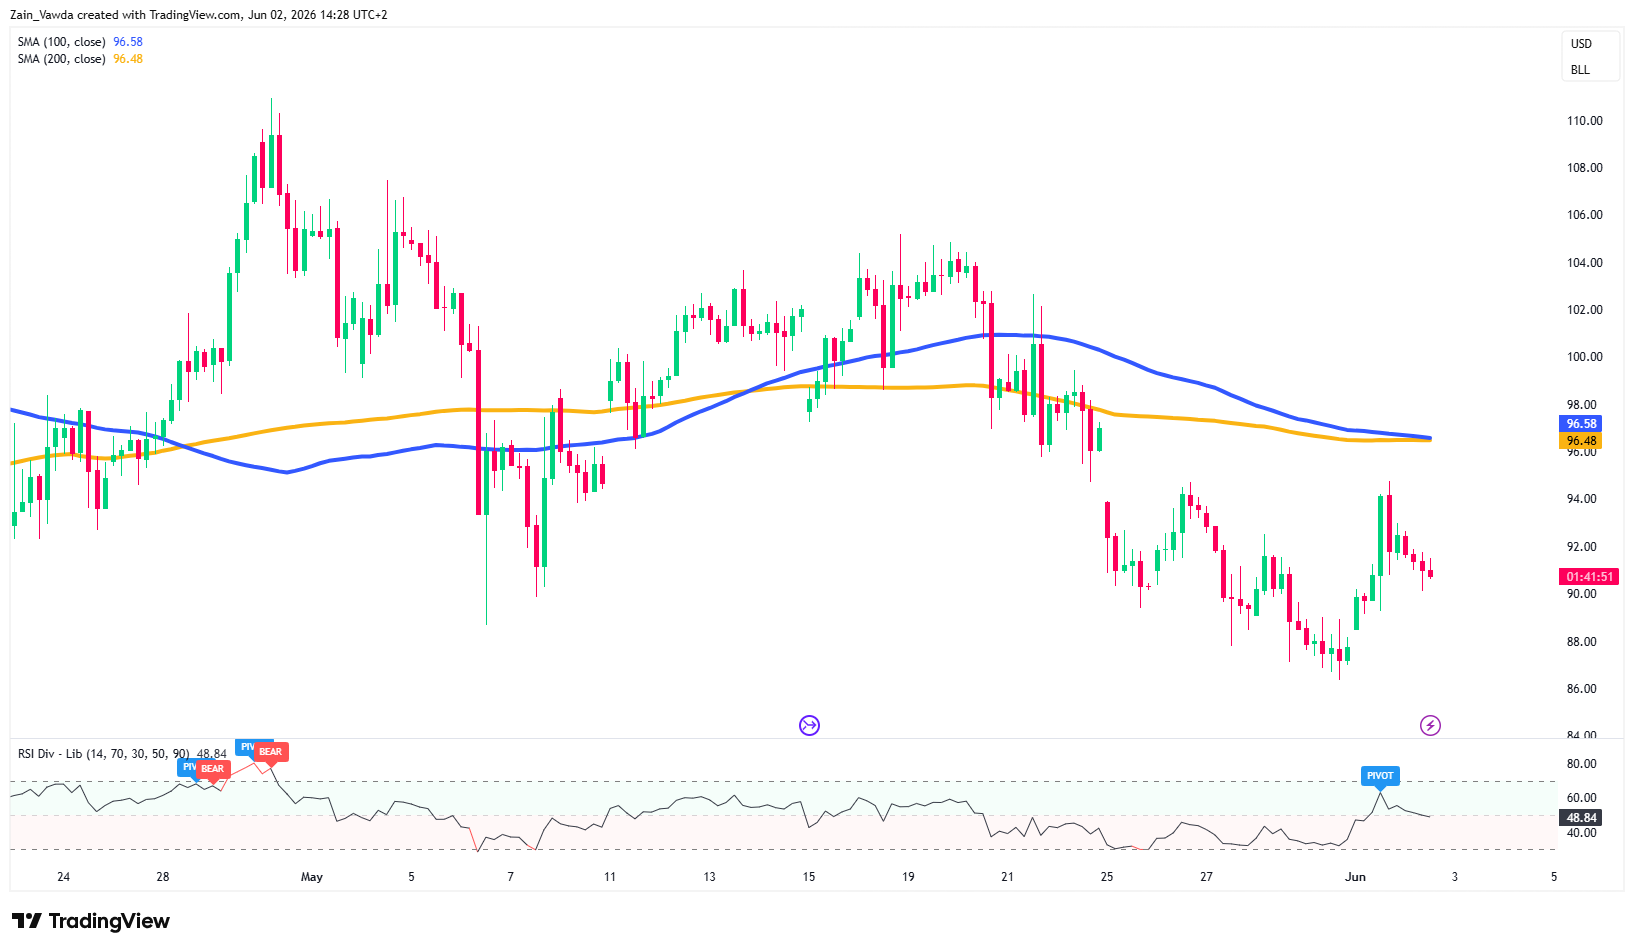
Crude Oil futures (CL1!) are showing a bearish bias on the 4-hour chart.
The price has slipped well below its 100-day and 200-day Simple Moving Averages, which are currently converging in a death cross structure near $96.50, functioning as major overhead resistance.
The RSI has rebounded slightly from oversold territory to 48.84, flashing a temporary "PIVOT" signal.
Oil Futures (CL1!) Four-Hour Chart, June 2, 2026
Source: TradingView
Bearish Scenario: If the recent corrective bounce stalls, a breakdown below the immediate support floor at $87.00 will likely target the $85.00 level.
Bullish Scenario: A sustained break above the $92.50 minor resistance could trigger a short-squeeze toward the key $96.50 moving average cluster.
Read Next: S&P 500 Enters June at All-Time Highs — And Sentiment Says the Rally Isn't Over


