
Oil futures (CL1!) surged on Wednesday to trade near $76.00 after the U.S.–Iran ceasefire collapsed.
Fresh U.S. strikes on Iran, the revocation of Tehran's crude export waiver, and Iranian retaliation against U.S. military sites in Bahrain and Kuwait have restored a Strait of Hormuz supply-risk premium that markets had spent June pricing out.
The technical picture has repriced just as violently, here is the breakdown from H4 down to M15.
H4: Breakout From the $67.42 Base — Trend Reversal in Motion
Oil Futures Four-Hour Chart, July 8, 2026
Source: TradingView
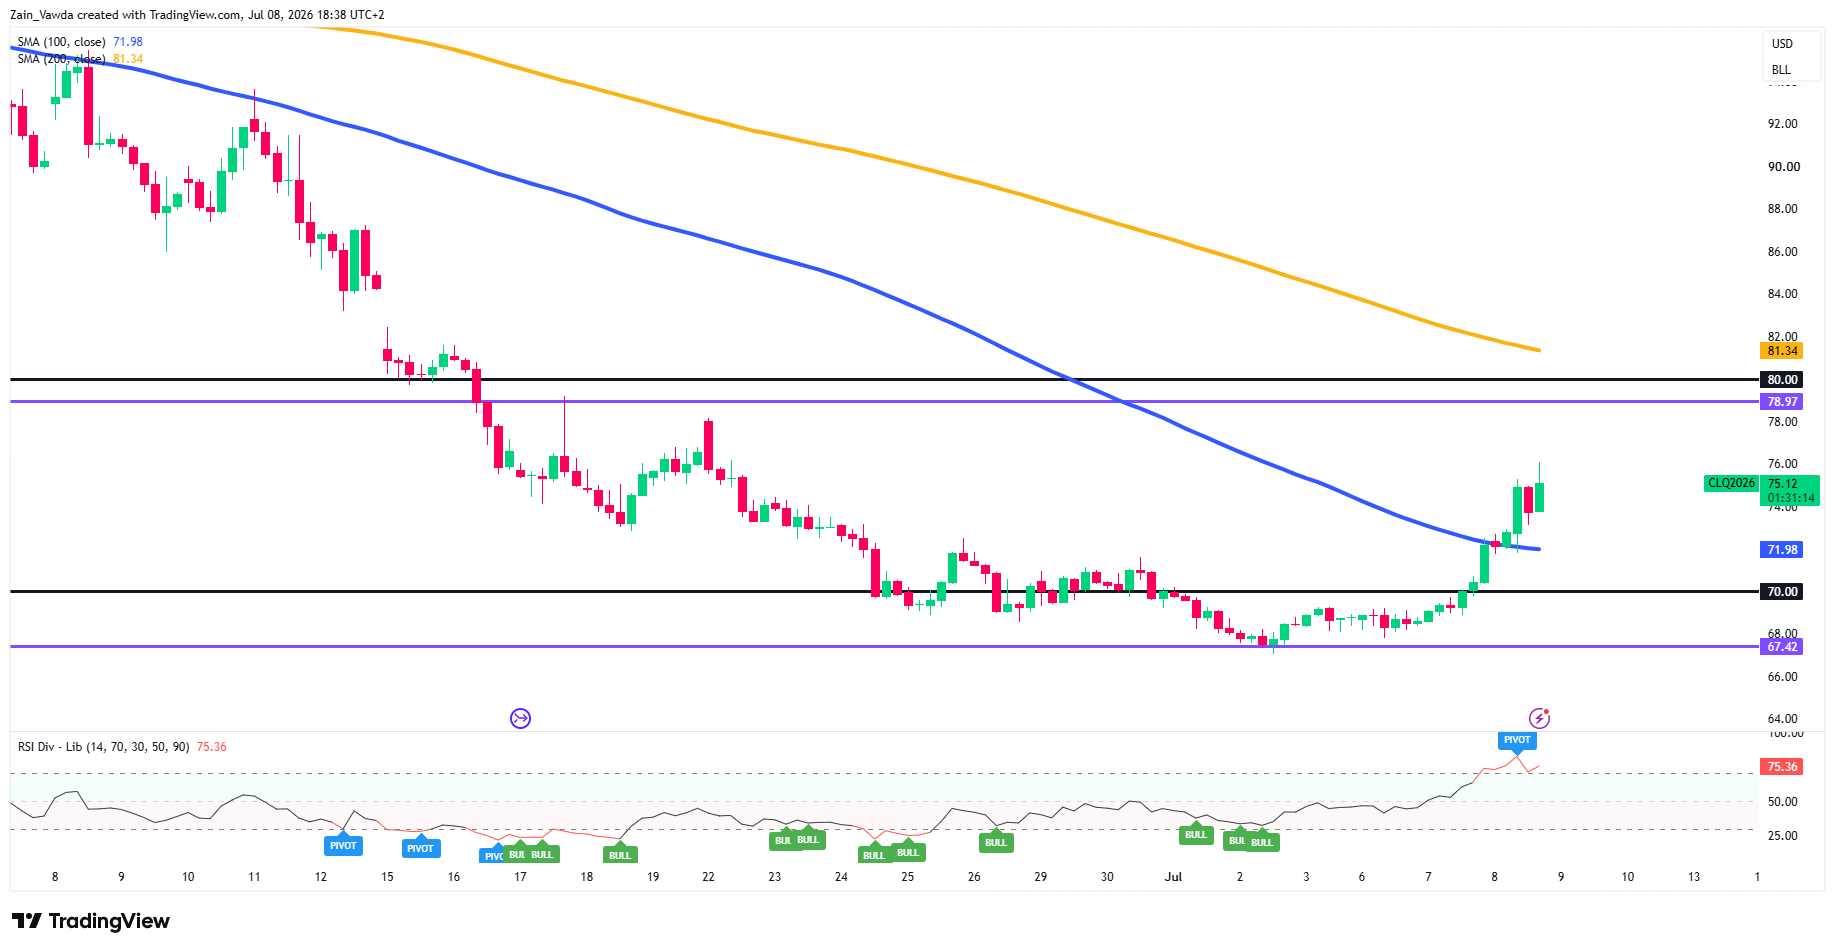
The four-hour chart shows the structural shift.
From the early-June highs above $93.00, crude ground lower for a month, basing between the $67.42 support and the $70.00 psychological level.
This week's breakout has cleared both $70.00 and the 100-day MA at 71.98 in a near-vertical move, the first decisive break of the H4 downtrend structure since June.
Overhead, the next obstacles are $78.97, the $80.00 handle, and the still-declining 200-day MA at 81.34.
The caveat: H4 RSI prints 75.36, deep in overbought territory with a pivot forming, extended rallies from a one-month base rarely travel in a straight line.
H1: Golden Cross Brewing, but Divergence Flags Are Stacking Up
Oil Futures One-Hour Chart, July 8, 2026
Source: TradingView
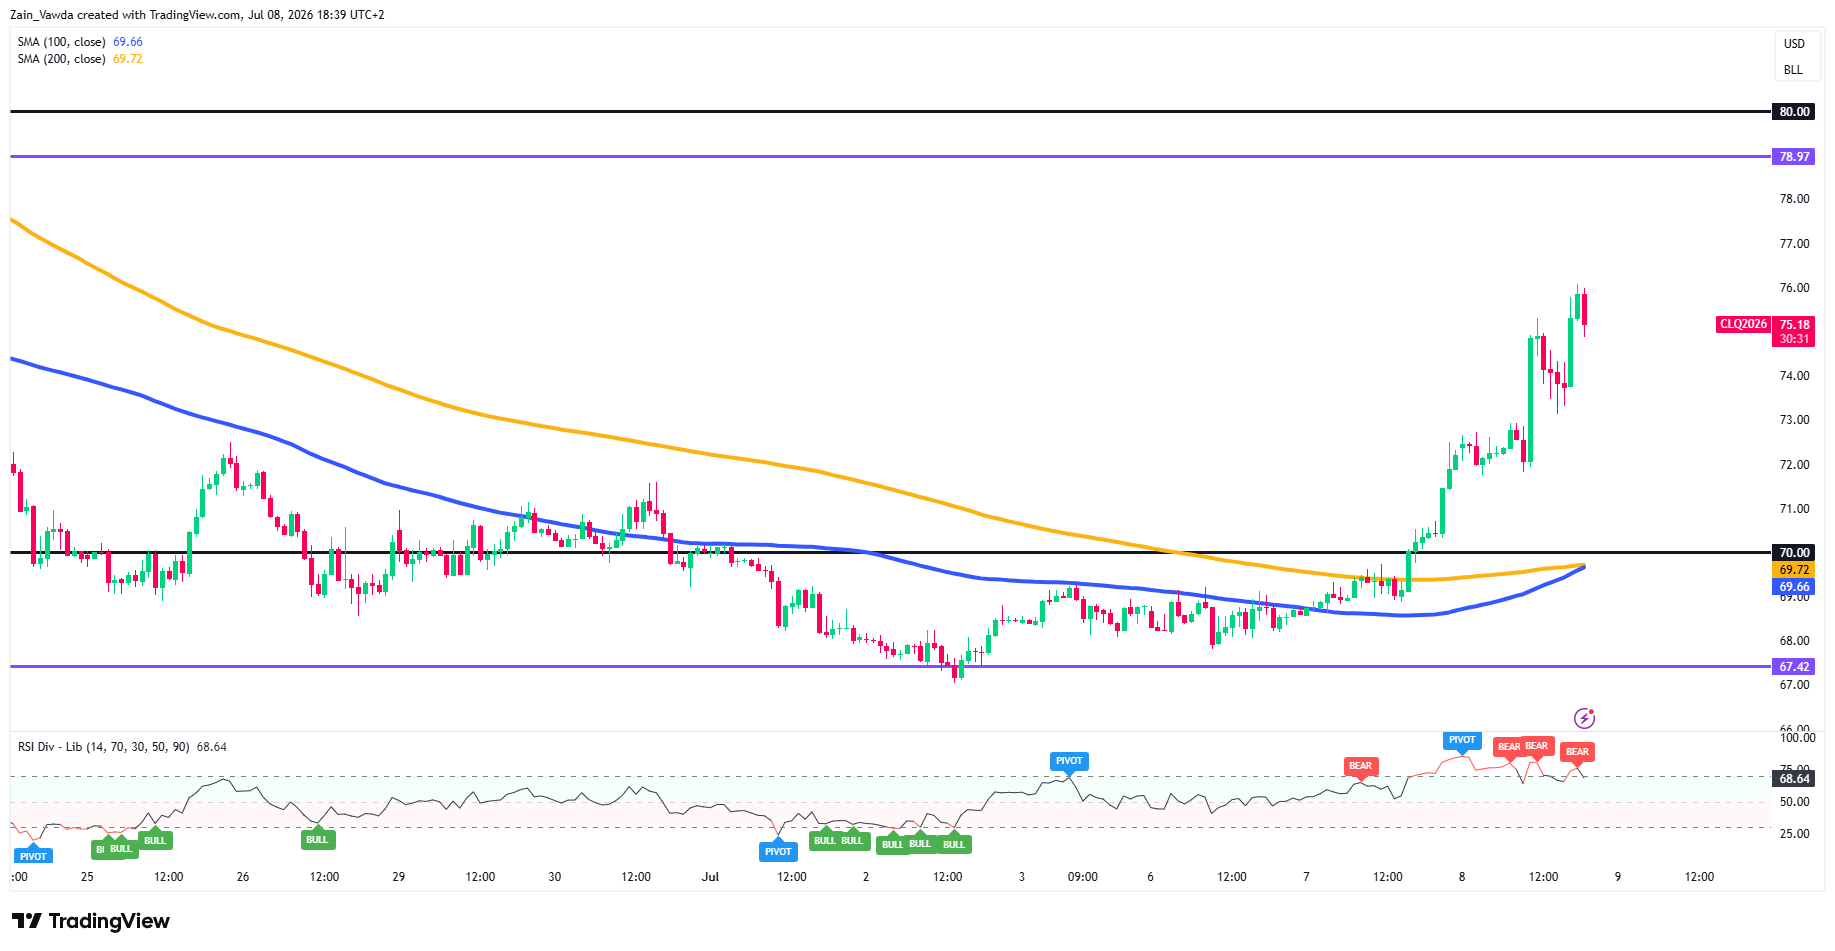
The hourly chart adds nuance. The 100-day MA (69.66) and 200-SMA (69.72) are converging just below the $70.00 breakout shelf, setting up a potential golden cross that would confirm the trend change.
Price at $75.18 is, however, heavily extended above both averages, and the H1 RSI (68.64) has printed repeated bearish divergence signals into the highs, momentum is not confirming each new push.
That combination typically resolves via consolidation or a pullback toward the breakout zone rather than immediate continuation.
First meaningful H1 support sits at the $72.00–72.50 consolidation, then the $70.00/MA-cluster confluence.
M15: Ascending Trendline Intact, Momentum Cooling Into 76.00
Oil Futures M15 Chart, July 8, 2026
Source: TradingView
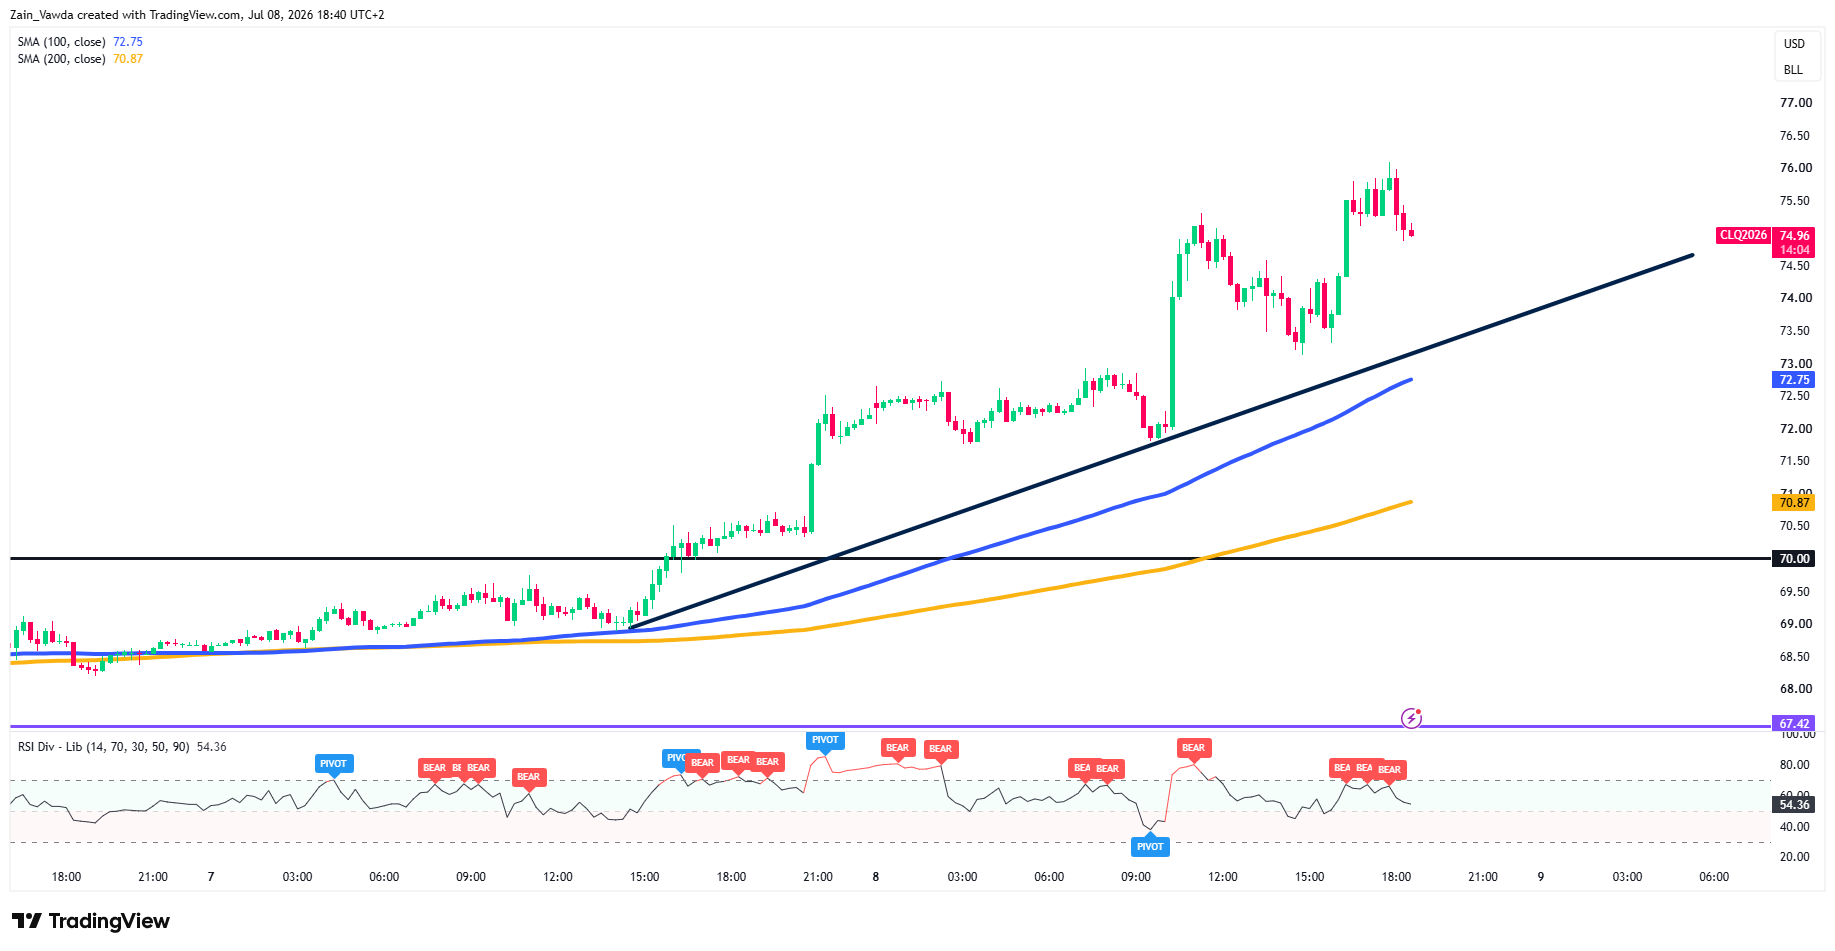
Intraday, the structure remains constructive: a clean ascending trendline has guided the advance from below $69.00, with price stair-stepping higher above the 100-day MA (72.75) and 200-day MA (70.87).
The session high near $76.00 is now the intraday ceiling, and the M15 RSI has cooled to 54.36 after a cluster of bearish divergence tags at the highs, buyers are pausing, not capitulating.
A trendline break below $73.50 would open the 100-day MA at $72.75; holding the trendline keeps a retest of $76.00 and an extension toward $78.97 on the table.
What Comes Next
Moving forward now and all eyes will be focused on the U.S.-Iran situation. Further Hormuz escalation and shipping disruptions widen could send oil prices soaring toward the $80.00 psychological level.
If the status quo remains as it is right now, there is the possibility of a short-term pullback as evidenced on both the M15 and one-hour timeframe.
Lastly, if the ceasefire is revived / diplomatic off-ramp then the risk premium unwinds and oil could retest the $70.00 barrier.


