Since our “moving-average vice” call, NQ has done what a genuine recovery does: it reclaimed the wall that was capping it and pushed the fight one level higher.
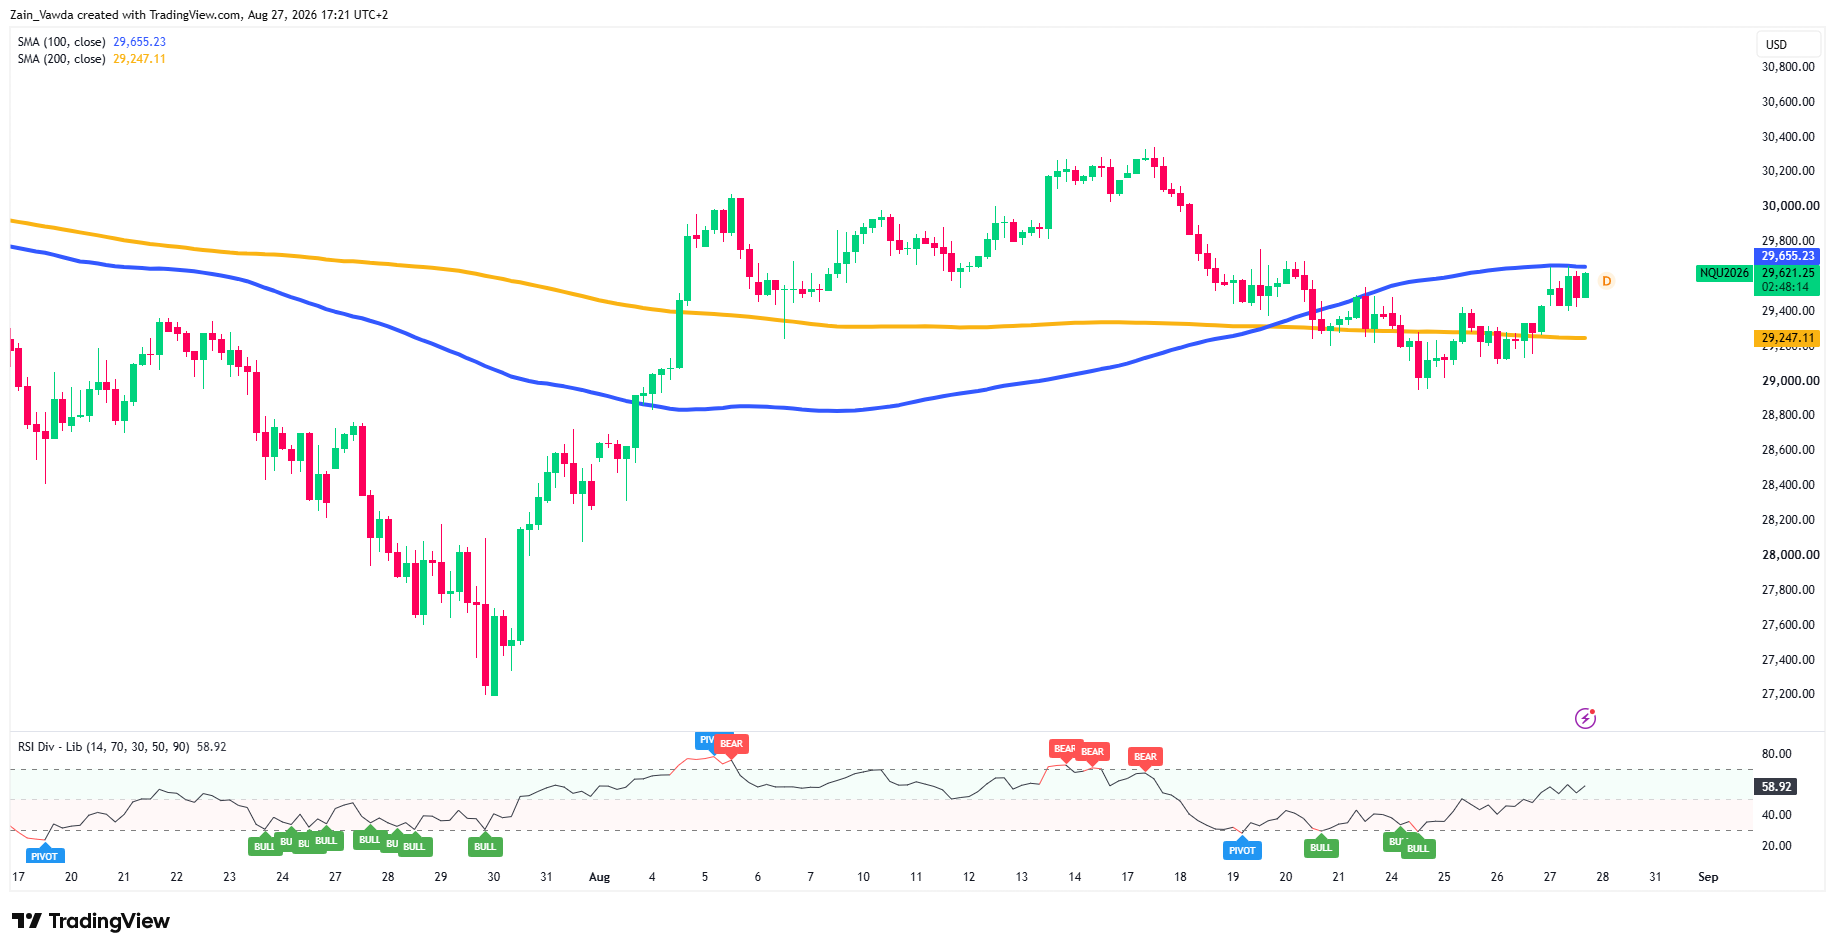
After Nvidia’s print, price spiked to about 29,680 overnight, faded, and is now grinding back to press the last barrier overhead, the 4-hour 100-period average at 29,655.
The three timeframes agree on direction but disagree on how much room is left, and that gap is the whole trade.
Four-Hour Chart: One Wall Left
The slow chart is the honest one. Price has climbed back over the 200-SMA (29,247) and the entire late-August base, but it is sitting just under the 100-SMA at 29,655 — the single barrier between this bounce and the mid-August highs near 30,200–30,300. RSI at 58.9 is rising with no divergence; the bearish RSI tags on this frame belong to the ~30,300 top three weeks ago, not to today. Bias stays up while 29,247 holds, but the recovery is not confirmed until 29,655 gives way on a closing basis.
Nasdaq 100 (NQ) Four-Hour Chart, August 27, 2026
Source: TradingView
One-Hour Chart: Reclaimed, Not Yet Golden
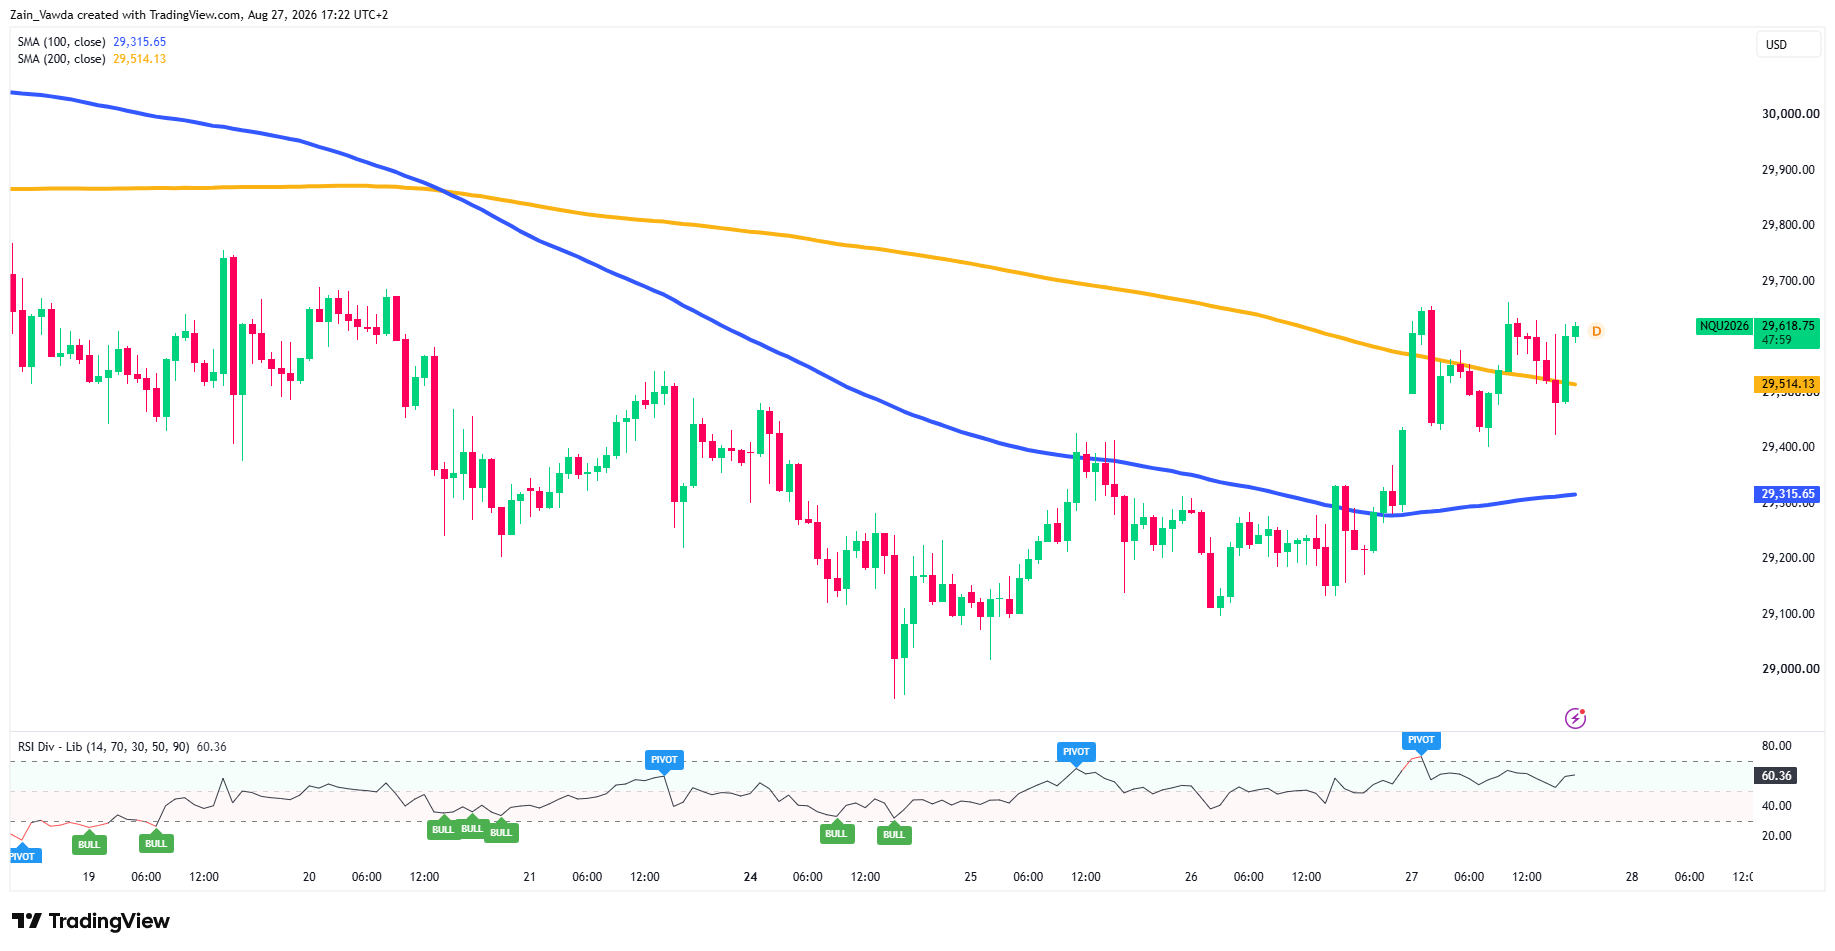
Price has pushed above both hourly averages, the 200-MA at 29,514 and the 100-MA at 29,315, flipping the short-term tape out of the down-stack that ran it lower last week.
The catch: the 100 is still below the 200, so the trend change is real but early.
Treat 29,514 as the pivot: hold above it and the recovery keeps its footing; lose it and price slips back into the range. RSI at 60.4 is confirming the push.
Nasdaq 100 (NQ) One-Hour Chart, August 27, 2026
Source: TradingView
15 Minute Chart: Bullish, but Momentum is Hesitating
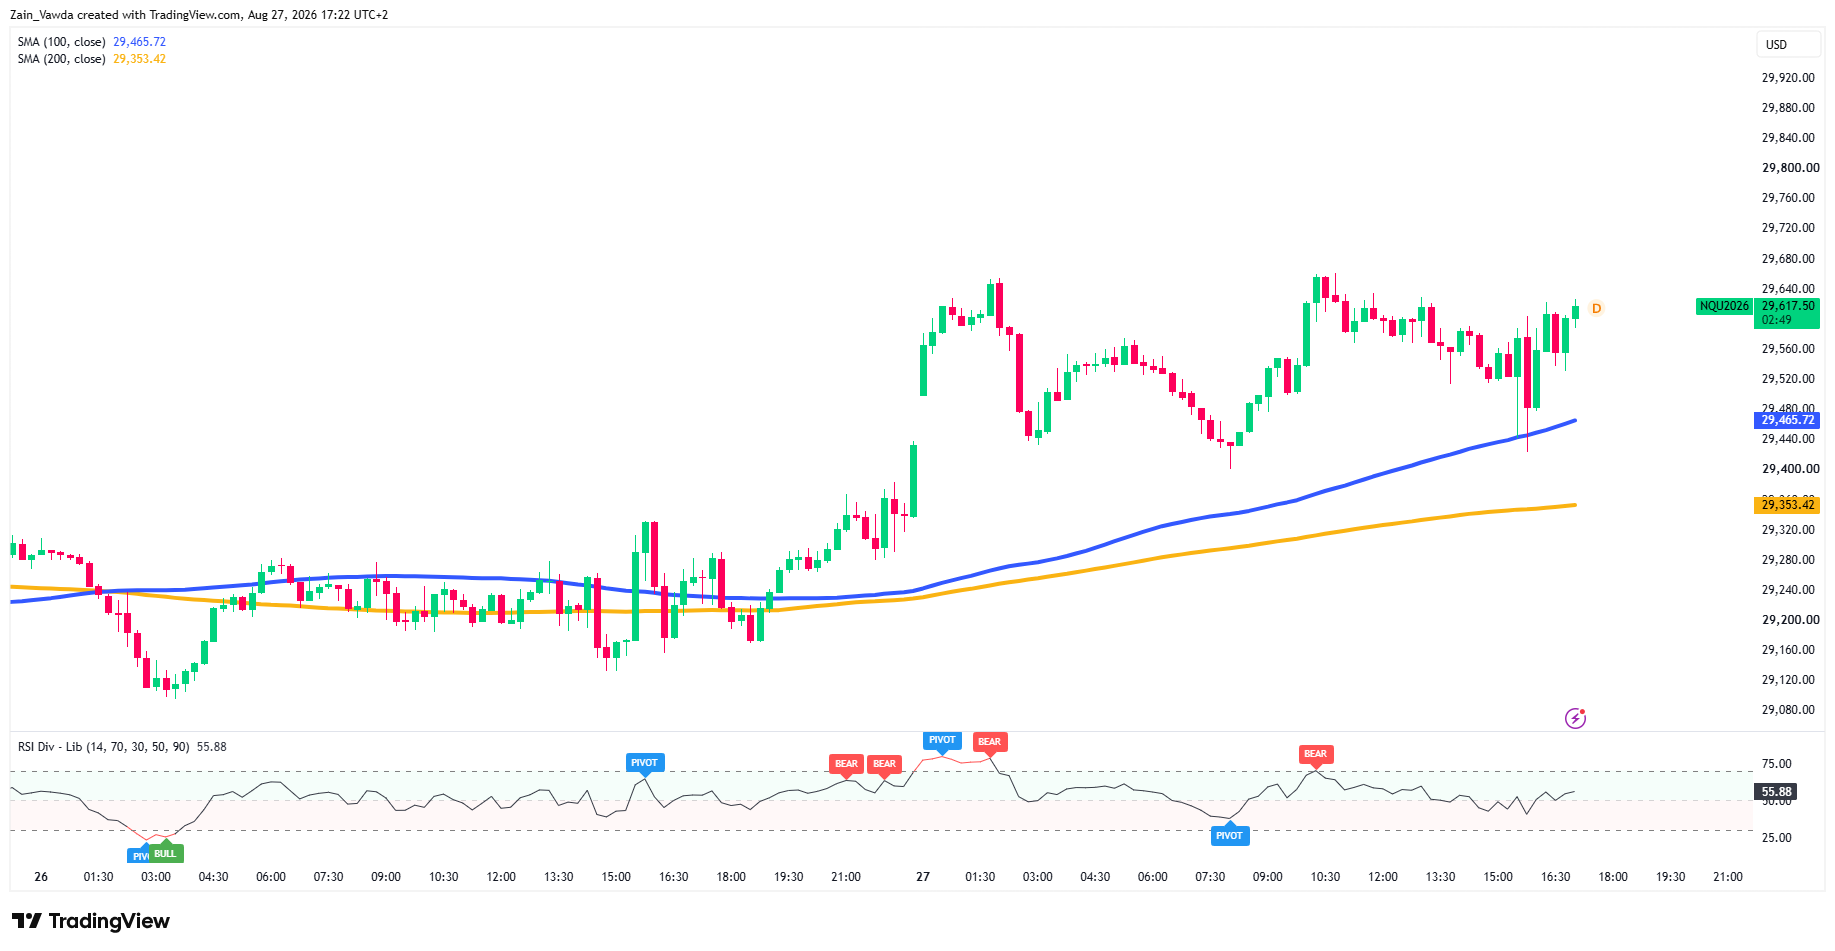
The fast chart is the most constructive: the 100-MA (29,465) sits above the 200-MA (29,353), both rising, with pullbacks bought at the averages.
The warning is written into the same chart, the overnight run to ~29,680 printed a bearish RSI divergence (higher price, lower momentum), which is precisely why the spike sold off.
With RSI back at 55.9, the second attempt at 29,655–29,680 needs momentum to confirm, or the risk is a lower high and a double-top rejection.
Nasdaq 100 (NQ) 15-Minute Chart, August 27, 2026
Source: TradingView
Potential Triggers
For bulls to seize control, 4H candle close above 29,655 (clears the ~29,680 o/n high) with 30,000 and 30,300 coming into focus.
For bears, a break below the 29,465 opens up a slide toward 29,315 before the 200-MA 29,247 comes into focus reopening a run toward the 29,100–29,000 level.
Trader Positioning Data
NQ positioning data based on the MarketFramework Positioning Edge Data Tool highlights an extreme bearish divergence as smart money aggressively sells into the intraday bounce (+0.83% at 29,525). Profitable traders are 62% short (38% long) with a key average short entry above current prices at 29,554.83.
Conversely, unprofitable traders are trapped 58% long from an average entry of 29,495.17. This 20% positioning spread shows institutional accounts distributing into retail buying power.
When disciplined, profitable money builds heavy short exposure above current price action while retail chases the move, it signals high probability for an impending downward reversal.


