
The Nasdaq has started September under real pressure, and the charts have arrived at a decision point. NQ futures (the September contract) are trading around 29,155 after a sharp intraday drop, and on the daily chart price is now sitting just above a moving average that has supported the market all summer.
The selling comes down to one big theme: rising bond yields. When yields climb, fast-growing technology shares, which make up most of the Nasdaq tend to fall hardest, because their future profits are worth less once interest rates are higher.
Among individual stocks, the likes of Nvidia, AMD and Micron all down around 2%, and Microsoft and Alphabet each off more than 1%.
The Market Backdrop
Global bond yields kept marching higher. The US 10-year Treasury yield hit its highest since January 2025, Japan's 10-year reached levels last seen in 1996, and Germany's benchmark climbed to a 2011 high.
Traders worry that higher oil prices, WTI up around 3% above $88 and Brent above $92 on renewed US–Iran tension in the Strait of Hormuz will keep inflation sticky and nudge the Fed toward a rate hike when it meets in two weeks.
September is also historically a weak month for stocks, and money is rotating: energy ETFs hit fresh highs even as tech sold off.
The Daily Chart: A Crucial Line in the Sand
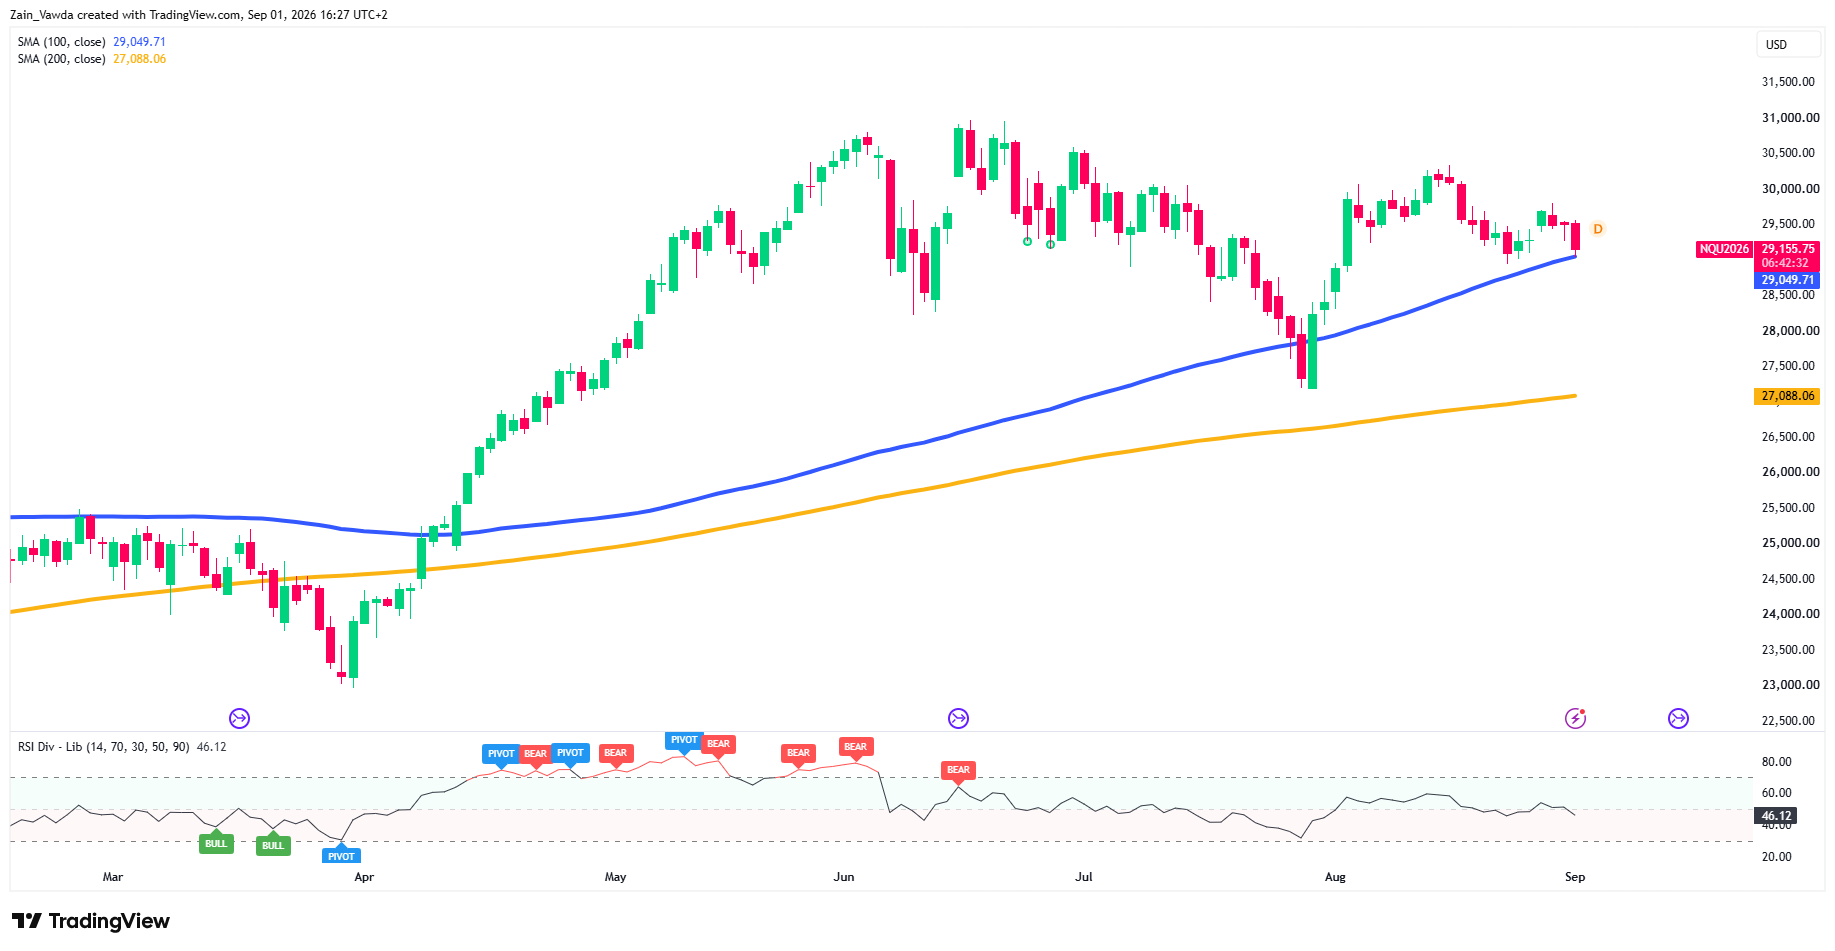
On the daily chart, the level that matters is the 100-day simple moving average at 29,049. A moving average is just the average closing price over the last 100 days, and traders use it to read the medium-term trend.
Price has ridden above this line through the summer and bounced off it during the early-August dip, so a firm break below would be a real shift in tone.
Nasdaq (NQ) Daily Chart, September 1, 2026
Source: TradingView
Two things make this test important. First, the 100-day average sits just above the round 29,000 mark, so 29,000–29,050 acts as one stronger support zone rather than two separate lines.
Second, the longer-term 200-day average is still far below at 27,088, which tells us the bigger uptrend that began back in April is not broken.
For now, price is testing support, not collapsing through it.
The Hourly Chart: A Sharp Breakdown
Zoom into the 1-hour chart and the short-term damage is clearer.
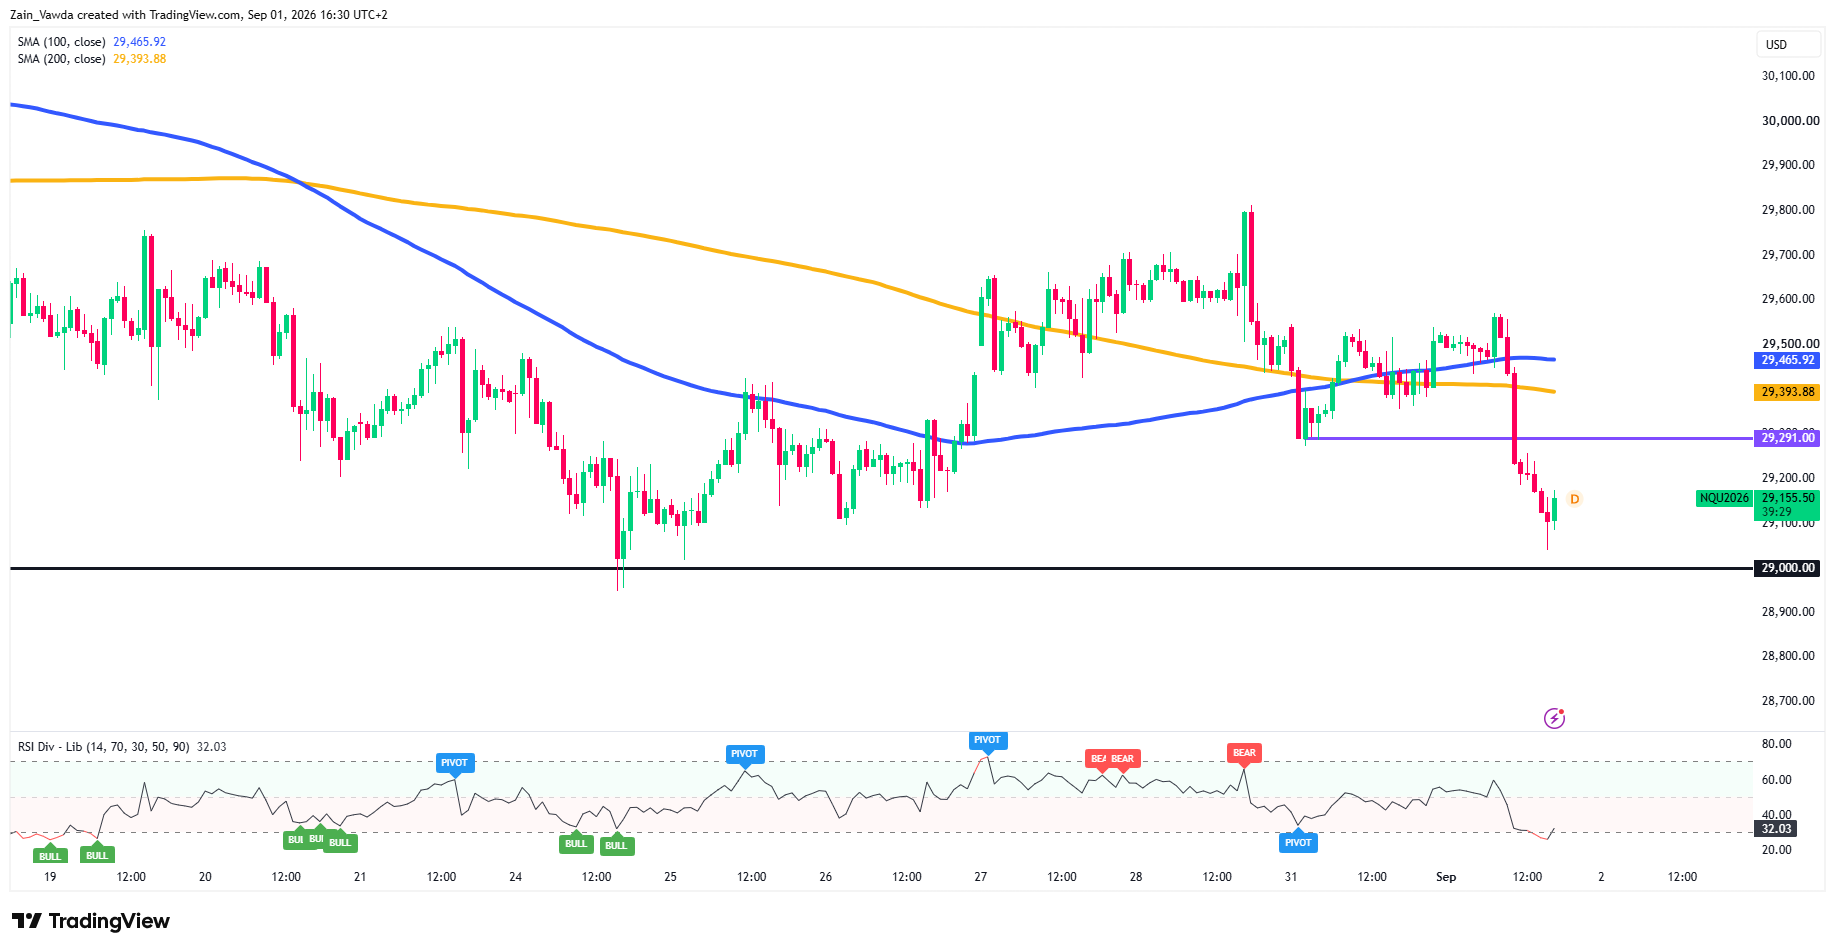
Price has dropped through both of its hourly moving averages the 200-period at 29,394 and the 100-period at 29,466, which now sit overhead as resistance.
More importantly, it has broken below the 29,291 shelf that had been holding as support for weeks. That broken level now becomes the first hurdle to clear on any bounce.
Nasdaq (NQ) One-Hour Chart, September 1, 2026
Source: TradingView
One note of caution for sellers: the hourly RSI, a simple momentum gauge, has dropped to about 32, close to “oversold” territory. That doesn't mean the fall is finished, but it does raise the chance of a brief pause or bounce before the next move.
Potential Scenarios for Price
The next big catalysts are Wednesday's ADP jobs report, Friday's non-farm payrolls, and the Fed meeting in two weeks.
Here is how the hourly chart could play out into that data:
Bearish: A clean break below the 29,000–29,050 zone (the round number plus the daily 100-day average) opens the door lower, with little firm support until the August lows near 27,500 and, further out, the 200-day average at 27,088.
Base case: Price holds the 29,000 zone and chops sideways between that support and the broken 29,291 shelf as traders wait for the jobs data before committing. The oversold hourly momentum supports this kind of pause.
Bullish: A reclaim of 29,291 hands the advantage back to buyers, though price would still need to clear the stacked hourly averages at 29,394 and 29,466 to repair the structure and aim back toward 29,500-plus.
Keep an eye on the latest Positioning Edge Data for an idea where the smart money is. For now the data shows signs of strong bearish divergence which could add a new dimension to your strategy.


