
Index futures are extending Monday's tech-led surge, with S&P 500 contracts up around 0.2% and Nasdaq-100 futures firmer near +0.6%. The rally on Monday was fueled by strong risk appetite across megacap technology stocks—including Meta (+6%), Alphabet (+4.9%), Microsoft (+4.9%), and Amazon (+4.6%), which crossed a $3 trillion market cap—alongside a drop in crude oil prices.
The question for traders heading into the U.S. Open is whether the rally will see a follow through or a potential pullback?
Nasdaq 100 (NQ) – Trend Intact, Ceiling Overhead (H1 & M15)
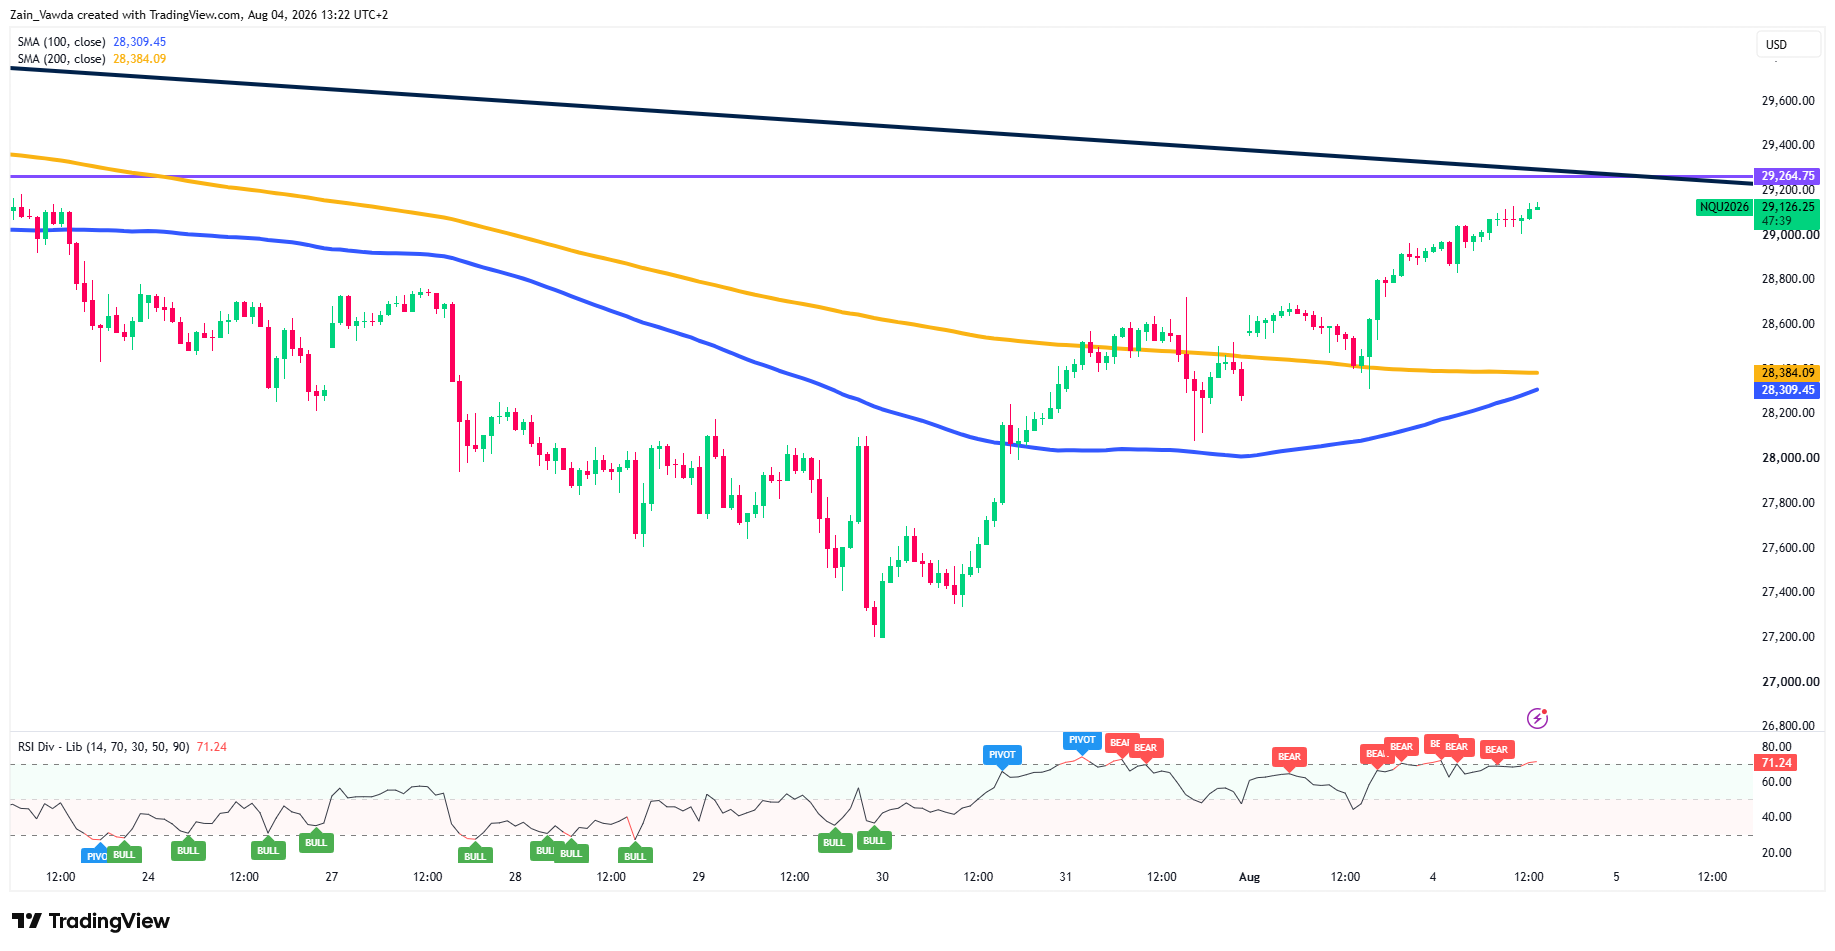
On the H1, NQ near 29,126 has staged a clean recovery from the late-July 27,200 washout, reclaiming both the 100-MA (28,309) and 200-MA (28,384), which are flattening and beginning to curl up beneath price.
The problem is what sits directly overhead: the 29,264.75 pivot is converging with the descending trendline drawn off the July 23 ~29,600 high, forming a hard confluence ceiling less than 150 points away. The H1 RSI at 71.24 is not only overbought but tagged with a run of bearish-divergence prints – momentum is thinning as price grinds the highs.
Nasdaq 100 H1 Chart, August 4, 2026
Source: TradingView
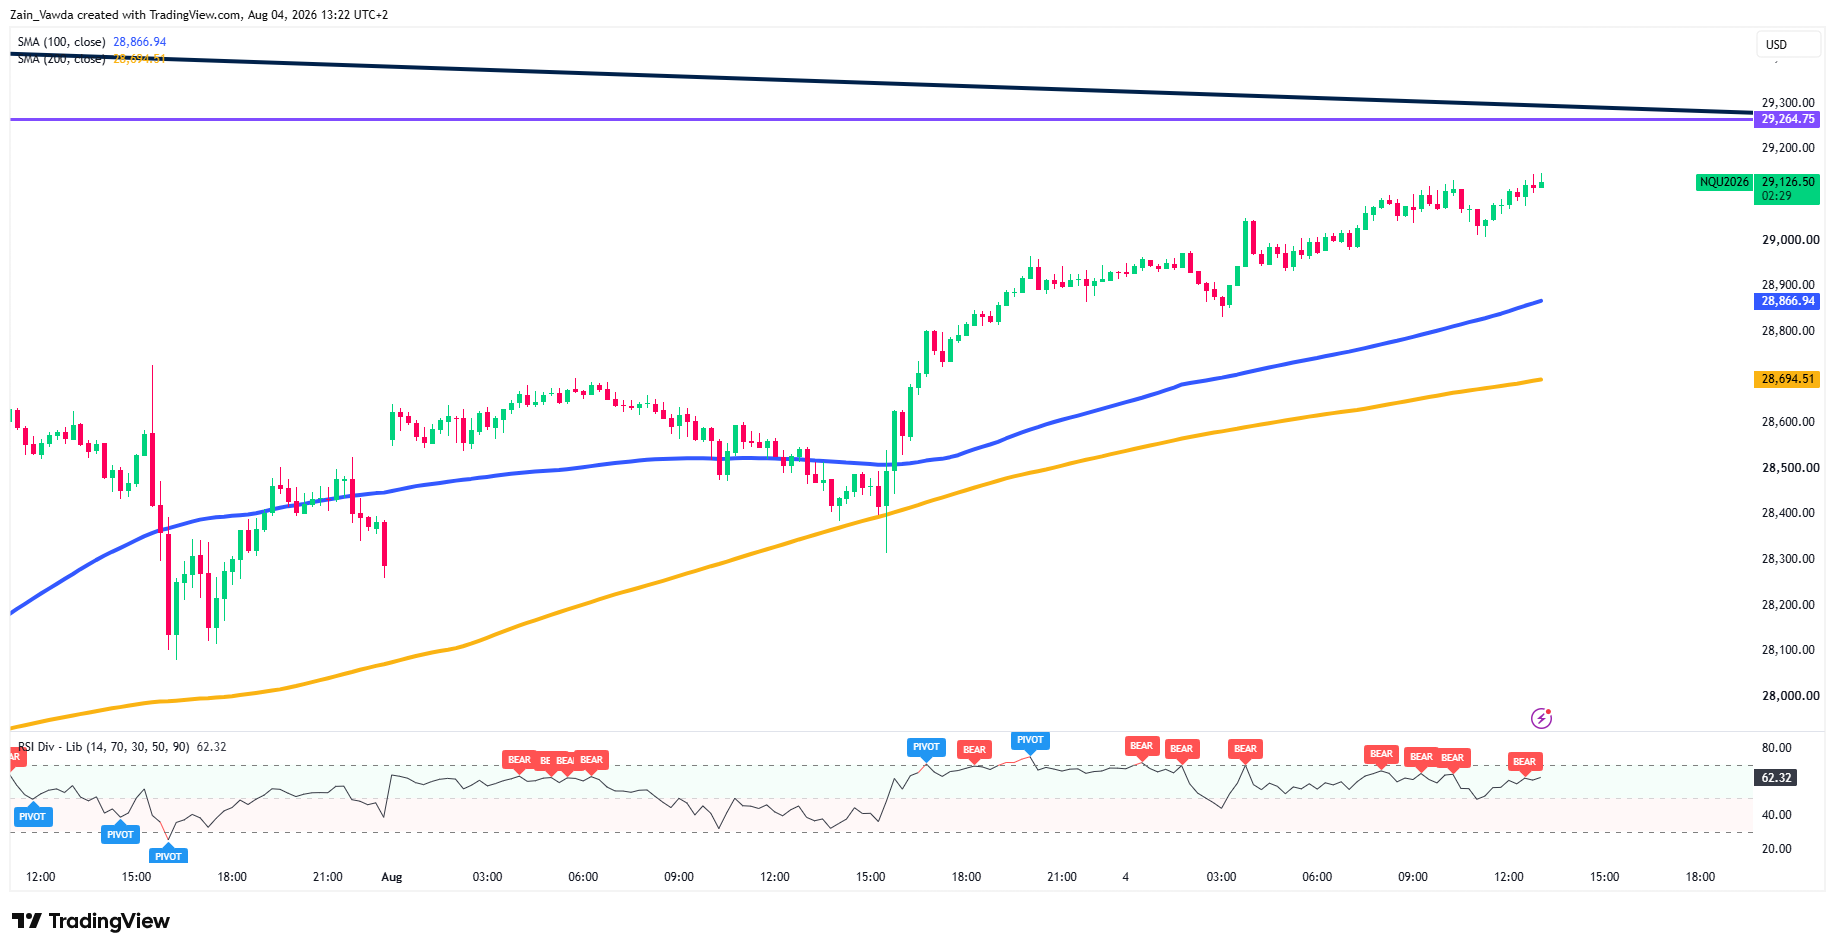
The M15 tells the same story on a shorter fuse: price rides a rising 100-MA (28,867) and 200-MA (28,695) in a textbook stair-step, but the sub-chart RSI (62.32) is again littered with BEAR tags at each marginal high.
This is a trend to respect, not a reversal to pre-empt – but the divergence stack means chasing into 29,265 is buying the worst price into the clearest wall.
Nasdaq 100 M15 Chart, August 4, 2026
Source: TradingView
S&P 500 (ES) – Cleaner Structure, Same Overhead Message (H1 & M15)
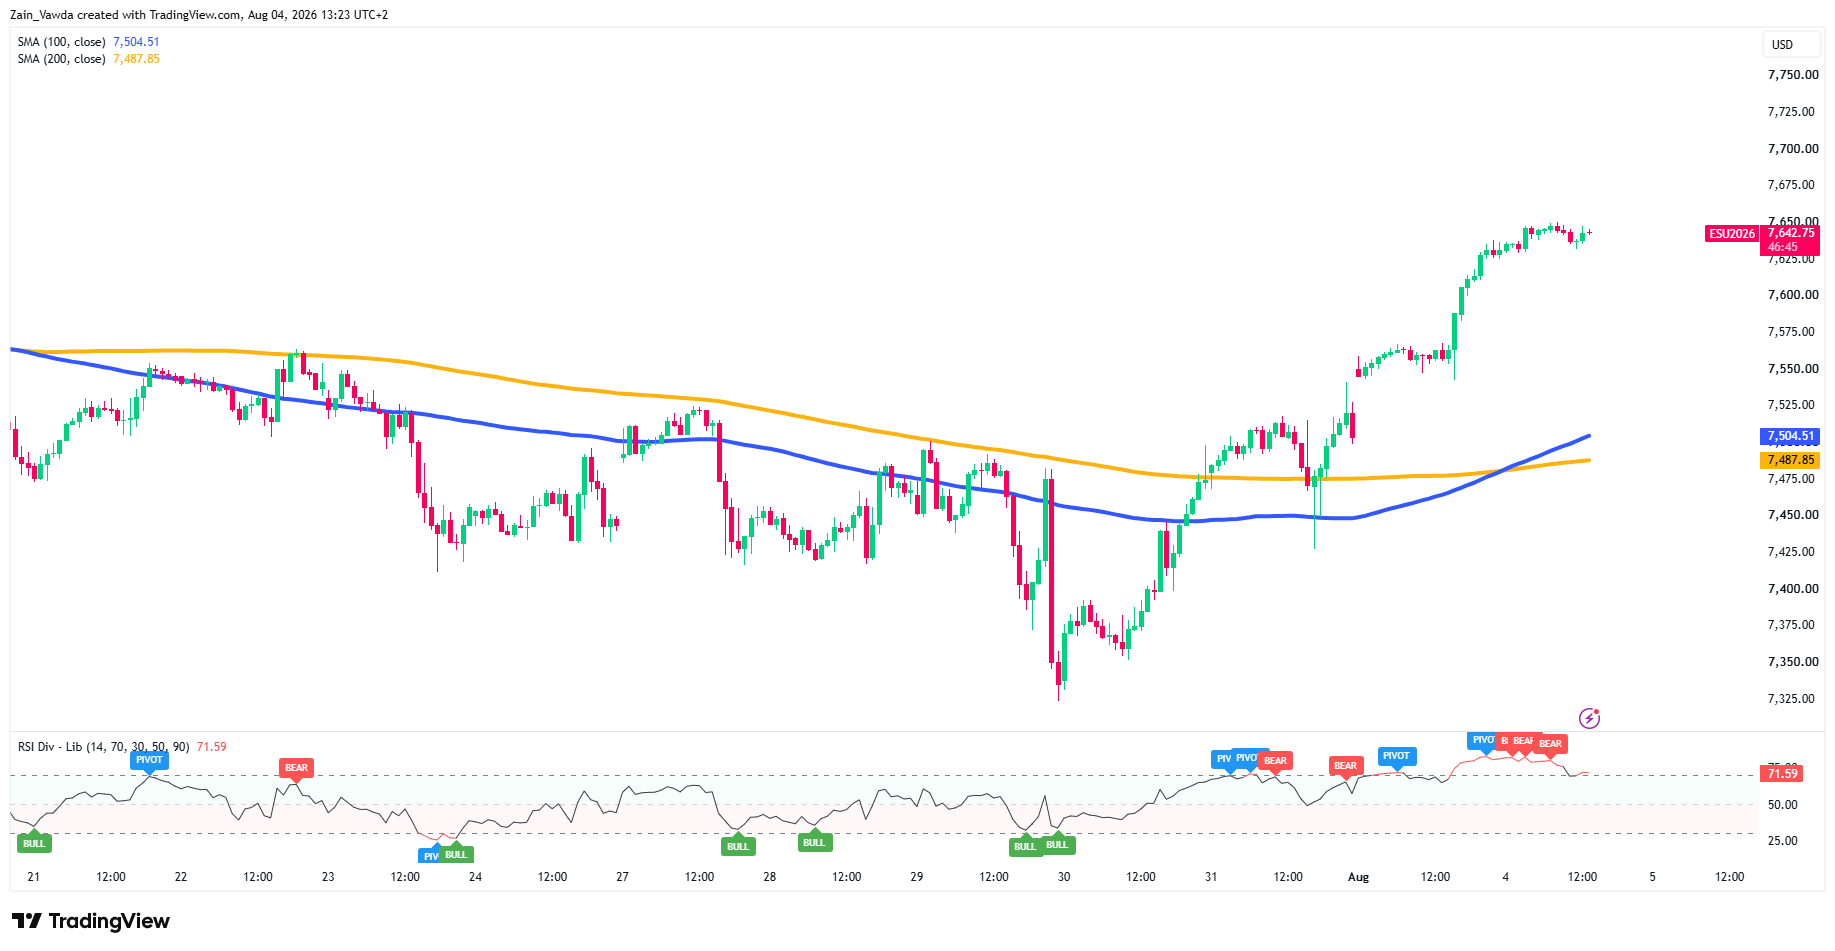
ES near 7,642 is the healthier chart. On the H1 it has ripped off the 7,325 low and now trades well above the 100-MA (7,504) and 200-MA (7,488), with the moving-average base rounding higher – no descending trendline capping it, just the 7,650 overnight high as the immediate line in the sand. The H1 RSI at 71.59 carries the same overbought-with-divergence caveat as NQ, so the read is momentum-mature rather than broken.
S&P 500 H1 Chart, August 4, 2026
Source: TradingView
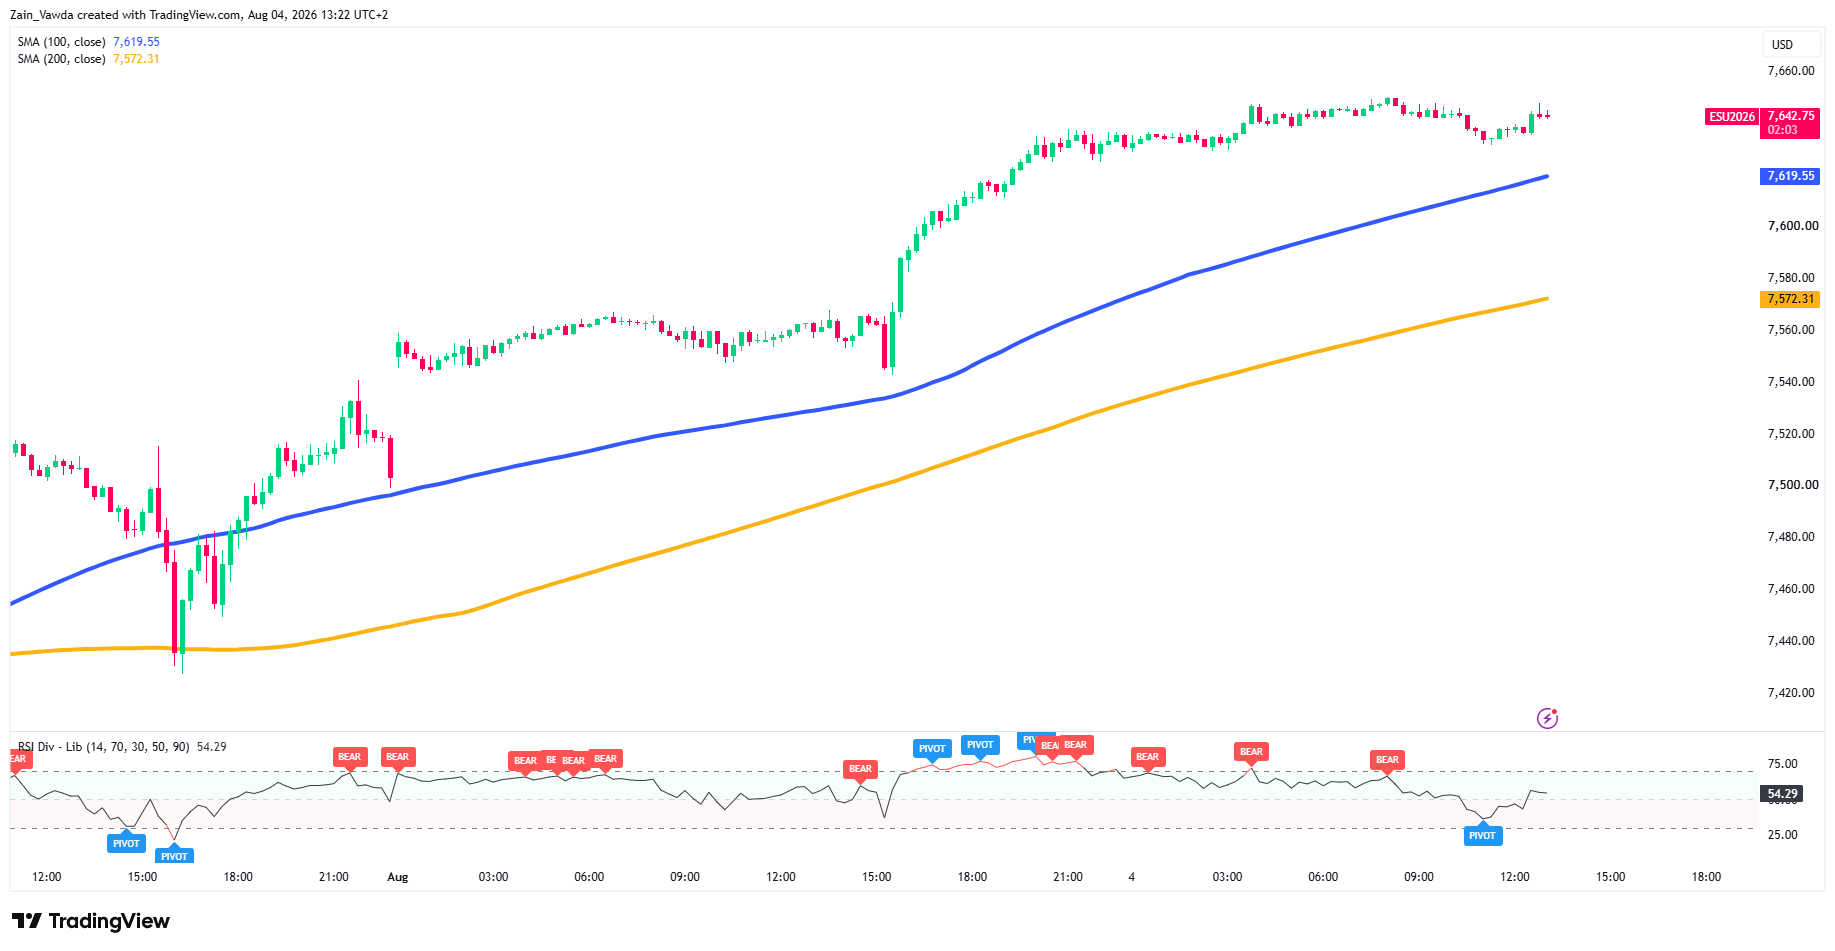
The M15 shows price stacked above a rising 100-MA (7,619) and 200-MA (7,572) after a shallow dip to ~7,545 was bought. RSI here is the calmest of the four charts at 54.29 – mid-range, with room to run before it's stretched – which is why ES, not NQ, is the cleaner long expression if the breakout extends. ES clears its ceiling with a simple push through 7,650; NQ has to fight a trendline to do the same.
S&P 500 M15 Chart, August 4, 2026
Source: TradingView
RSI here is the calmest of the four charts at 54.29 – mid-range, with room to run before it's stretched – which is why ES, not NQ, is the cleaner long expression if the breakout extends. ES clears its ceiling with a simple push through 7,650; NQ has to fight a trendline to do the same.
Retail Trader Sentiment
Looking at retail trader data from the MarketFramework Positioning Edge Tool, it shows 25% divergence between profitable shorts and unprofitable longs which creates an "Extreme Bearish Divergence" signal, indicating potential persistent downward pressure driven by retail trapped longs.
Summary
Given the performance pre-market the Nasdaq is over extended on both the H1 and M15 timeframes. This is cause for concern ahead of the U.S. open but it does not rule out further upside.
Smart traders may opt for wait for a pullback toward the 100-MA on the M15 for a better entry at around the 28,914 handle.
Scenarios Into the US Cash Open

Chart Created Using Canva
It is important to consider the above especially the rotation story and earnings season. Both could serve as a catalyst for a renewed bull run or a potential deeper pullback.


