The Nasdaq spent Monday in the red while the Dow climbed and that split is the whole story. This was not a broad selloff; it was money rotating out of tech and into defensives, which left NQ as the funding leg of the move.
The index has now slipped below the support shelf we have been tracking, and the next 24 hours comes down to whether an oversold bounce or the rotation wins.
The Tape Today: A Rotation, Not a Rout
Monday's headline numbers hid what was really going on underneath.
The Dow was the lone major index in the green, on track for its first back-to-back daily gains since 5 August, while the Nasdaq lagged. The driver was rotation: six of the eleven S&P 500 sectors finished higher, led by consumer staples (+1.4%), with information technology the clear laggard (-1.3%). In plain terms, investors were not dumping everything, they were shifting money out of growth and technology and into steadier, defensive corners of the market.
That is a very different signal from a broad risk-off day, and it explains why NQ underperformed even as the wider tape held up.
What Actually Dragged the Nasdaq
The weight on the Nasdaq-100 came from a narrow group. Hardware and memory names were the worst performers with Seagate, Micron and Western Digital all falling at least 5% and that single pocket of weakness was enough to tip the tech-heavy index lower while staples and healthcare propped up the Dow.
It was not all one-way: Strategy (MSTR) was the best performer in the Nasdaq-100, up nearly 3% as bitcoin extended its run. But with the market's biggest catalyst of the week still ahead on Wednesday, few traders wanted to add technology risk into the close, so the path of least resistance was lower.
The Charts: Below the Shelf We've Been Watching
Both timeframes (H4 and H1) tell the same story: sellers in control, but momentum stretched.
Nasdaq (NQ) Four-Hour Chart, August 24, 2026
Source: TradingView
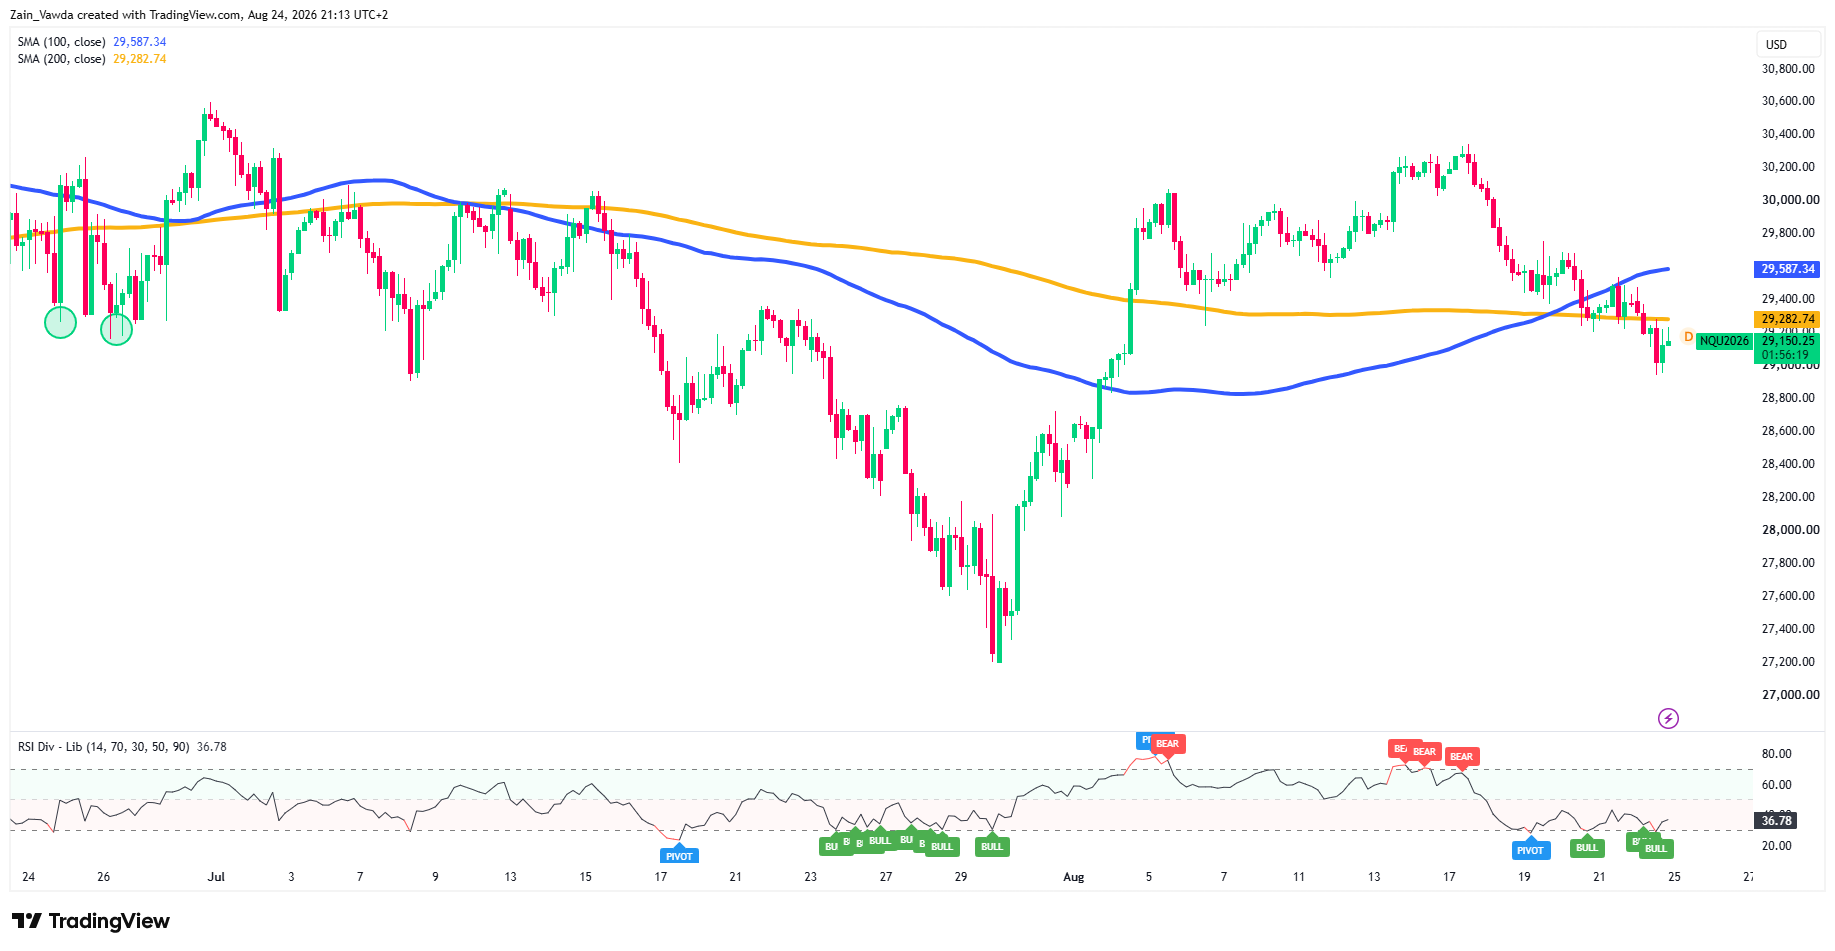
On the 4-hour chart, NQ near 29,150 sits below a declining 100-SMA (29,435) and 200-SMA (29,738), with the RSI at 43, a clean downtrend since the 30,300 peak on 17–18 August.
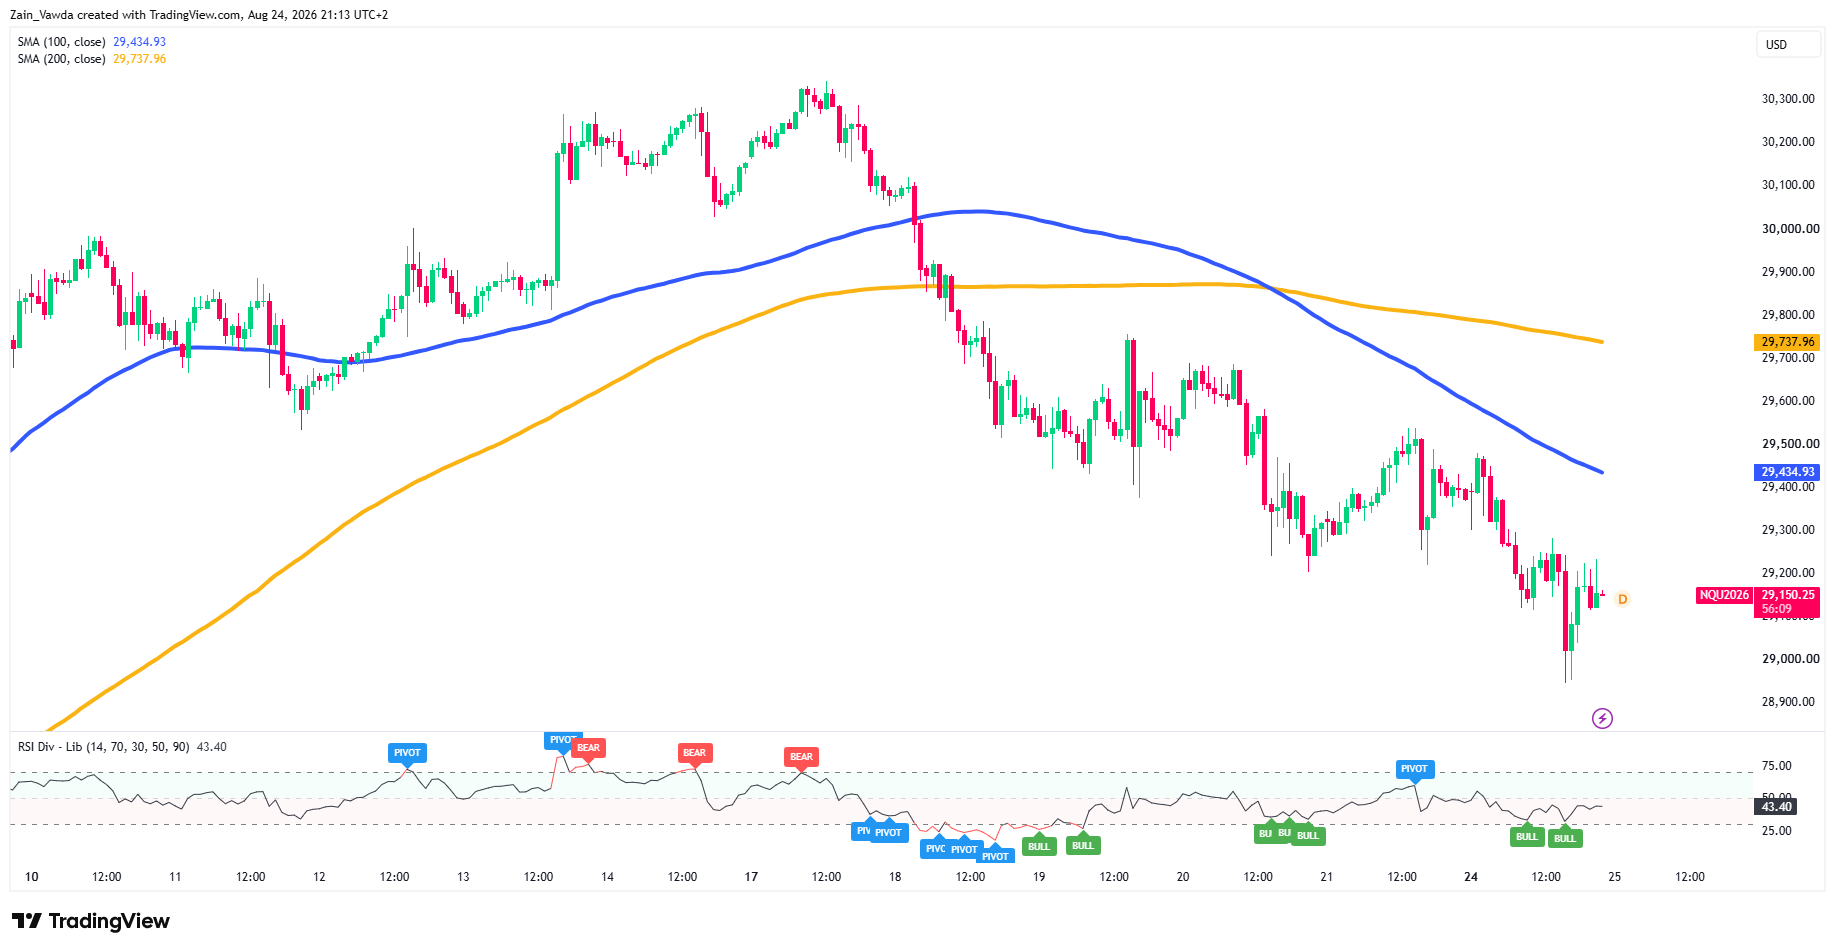
The 1-hour chart is weaker still: price is below both averages (100-SMA 29,587, 200-SMA 29,283), RSI down at 37, near oversold.
Nasdaq (NQ) One-Hour Chart, August 24, 2026
Source: TradingView
Critically, the 29,265–29,283 shelf we have been flagging, the recurring pivot plus the 1-hour 200-SMA has now given way, turning that zone from support into resistance.
The caution for bears: both charts are printing bullish RSI divergence at the recent lows, which often precedes a bounce. Below, the line in the sand is 29,000, then the 28,900 swing low.
The Next 24 Hours
With Consumer Confidence due Tuesday and the double-header of PCE and Nvidia landing Wednesday, the coming session is likely a low-conviction one, traders rarely make big bets right before events like these.
That argues for a choppy, range-bound drift unless the data forces a move. The bullish RSI divergence keeps a bounce live; the broken shelf keeps the trend pointed down.
Because this is a rotation, the cleaner expression is relative, not outright: long the Dow (YM) against short NQ captures the leadership split with less exposure to a broad-market whipsaw than a naked NQ short.
Make use of the latest Positioning Edge Data on MarketFramework to gain an edge in what could be an interesting 24 hours ahead of Wednesday double-header.


