
The Nasdaq index sits at 3-week highs while the Dow has soared to fresh all-time highs and both are overbought into a binary data morning — ADP at 8:15 and ISM Services at 10:00 ET. But the structure underneath them could not be more different, and that difference, not the direction of the tape, is where the edge sits for the US session.
The Nasdaq has just reclaimed a level it fought for weeks; the Dow is flying without one.
Nasdaq (NQ): A Fresh Breakout With a Floor Beneath It
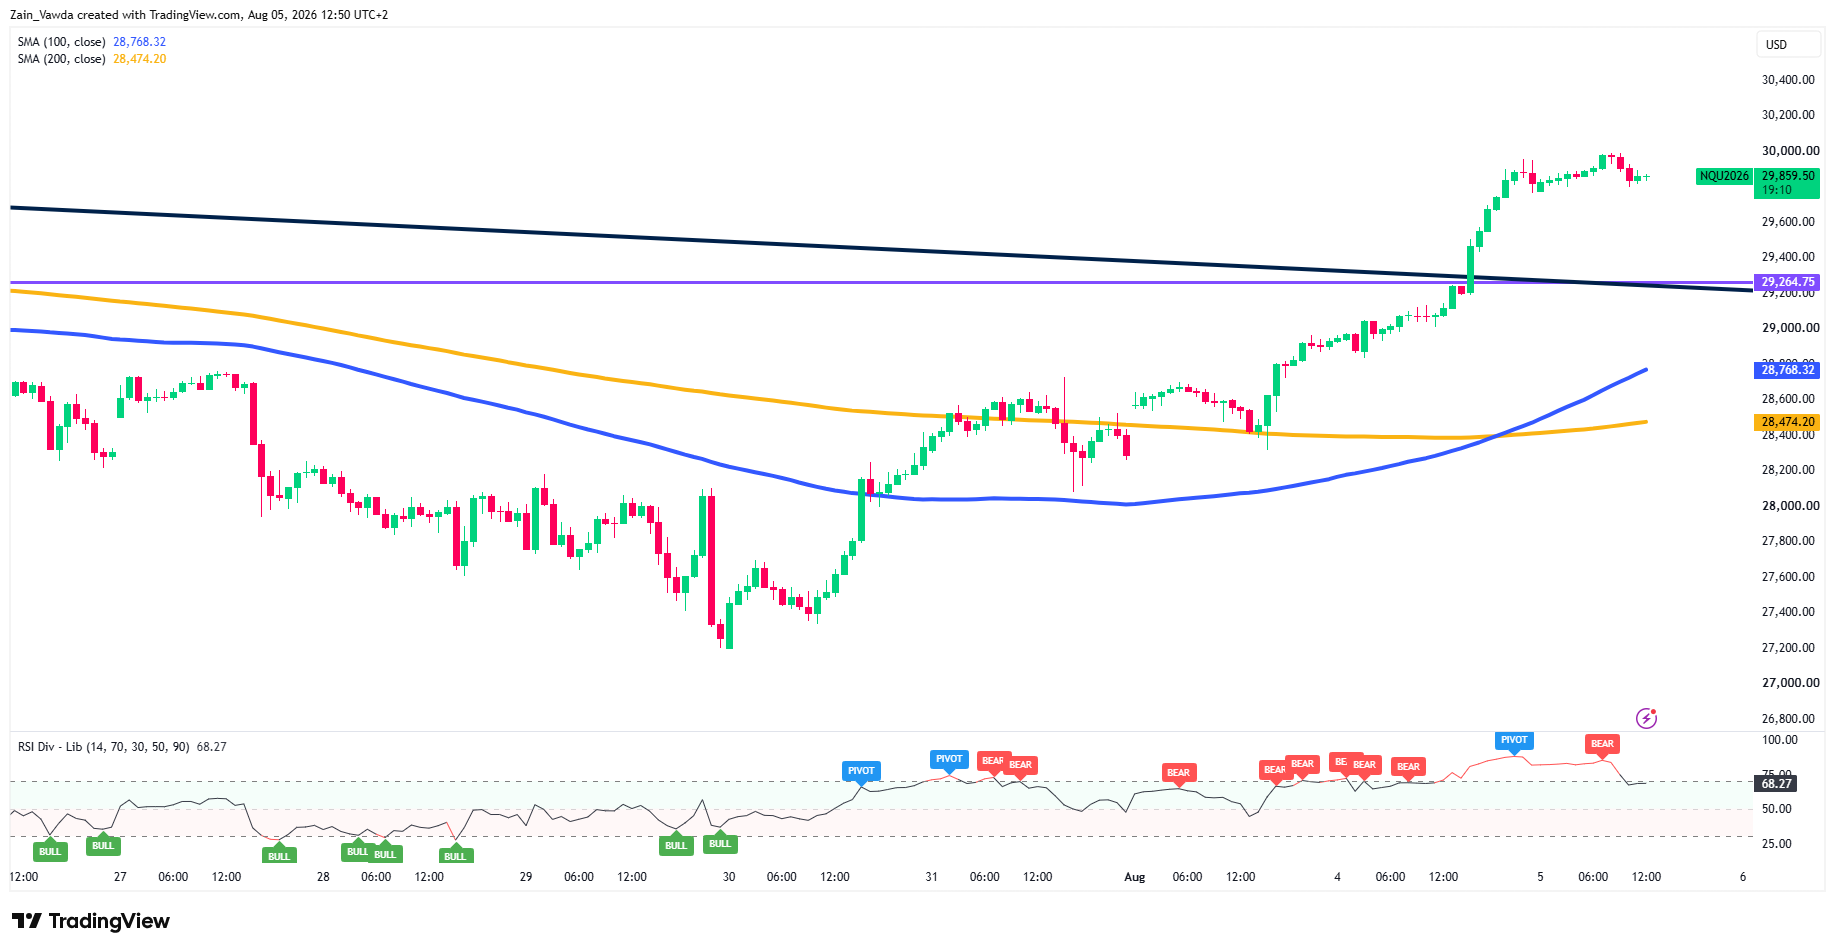
Nasdaq (NQ) is trading near 29,859 after a single decisive candle cleared two obstacles at once: the descending trendline drawn off the July 23 high and the 29,264.75 pivot that has capped every attempt since late July.
Price ran straight to the 30,000 handle and is now consolidating just below it. Momentum is the caveat — H1 RSI at 68.3 is carrying a fresh bearish divergence against the highs, so this is a confirmed breakout losing thrust, not a fresh impulse.
That still makes NQ the better-structured long, because the breakout leaves a defined retest zone to lean on.
The first shelf is 29,600 — late July's swing high, now flipped to support. Below that, the 29,200–29,265 confluence (the reclaimed trendline stacked on the old pivot) is the line that validates or kills the move. Hold it and pullbacks are buyable with a stop parked under 29,200; lose it and the breakout is a failure that re-exposes the 100-SMA at 28,768.
– Long trigger: pullback into 29,600, or a deeper tag of 29,265 that holds — target 30,000, then blue sky above 30,050.
– Fade only on a clean rejection wick at 30,000 with the RSI divergence confirming; that is a counter-trade, size accordingly.
Nasdaq (NQ) One-Hour Chart, August 5, 2026
Source: TradingView
Dow Jones (YM): Blue-Sky, But Running Without a Net
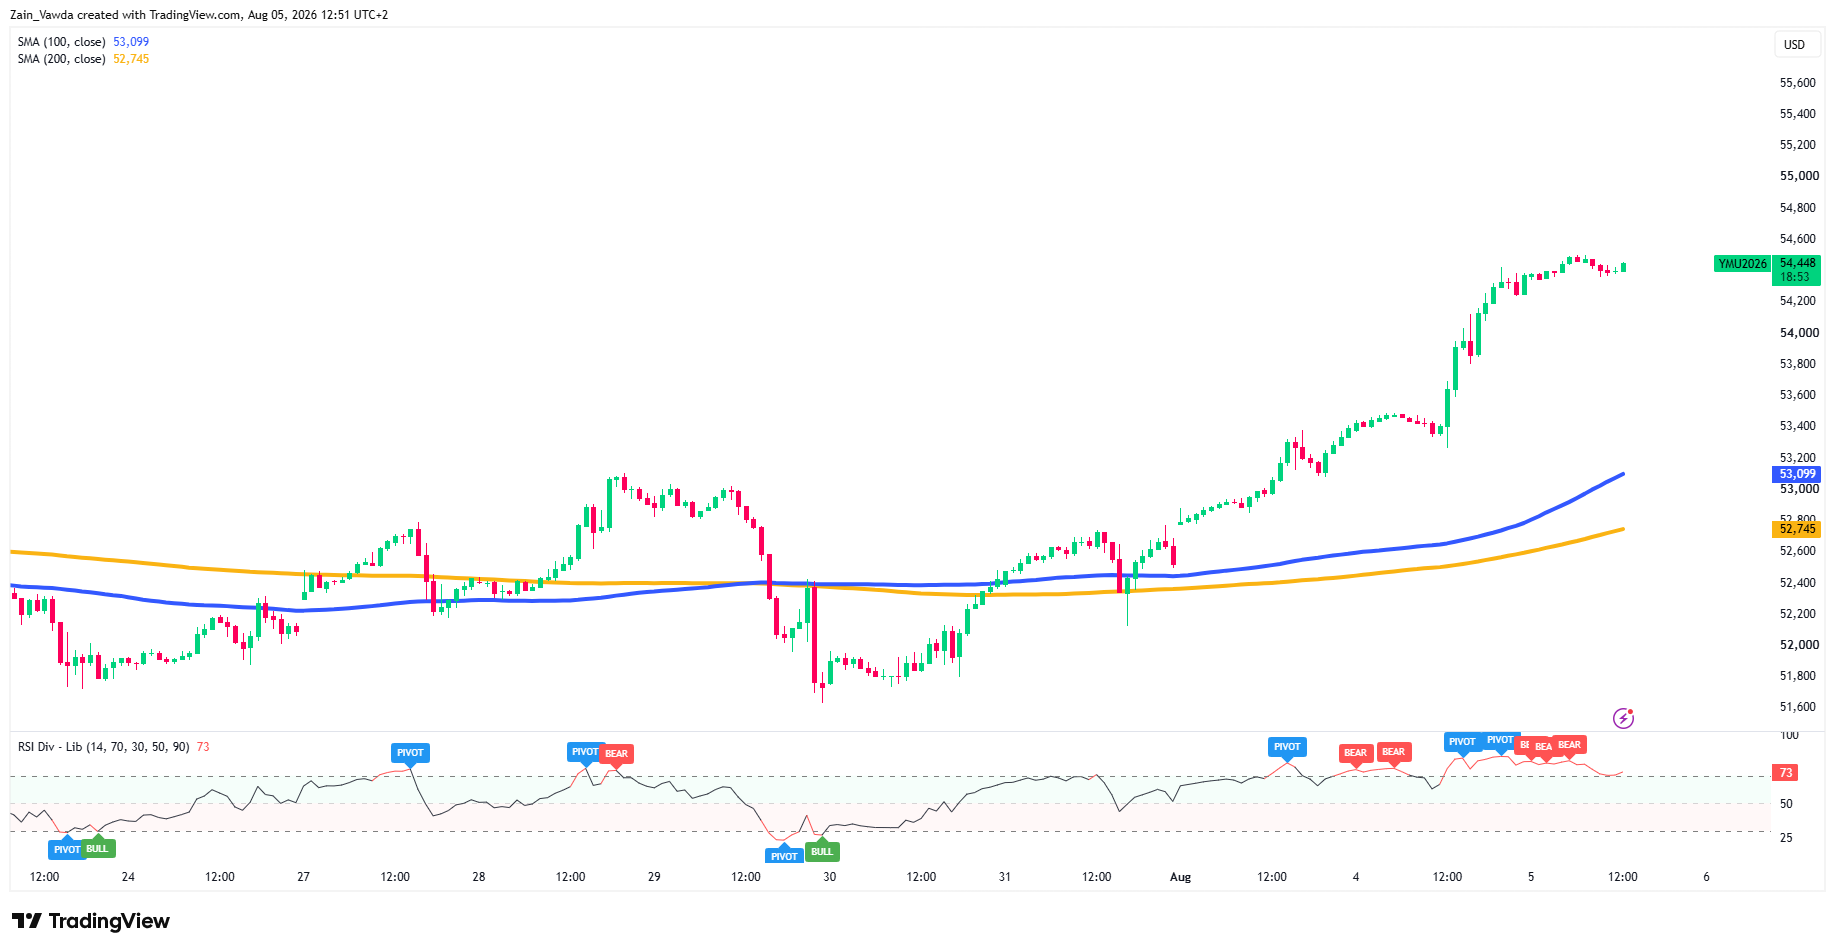
Dow Jones (YM) near 54,448, just off a 54,600 record, is the more extended of the two. H1 RSI is up at 73 and price is roughly 1,350 points above its 100-MA (53,099).
The problem for anyone chasing it is that record territory means no overhead reference — and, just as importantly, no nearby support. The first genuine shelf is the 53,400–53,600 consolidation from late July, a long way down, with the 100-MA beneath it.
So the Dow is the cleaner mean-reversion vehicle, not the cleaner long. Buying 54,600 into an 8:15/10:00 data print is paying full price for altitude with the parachute several hundred points below.
The higher-quality YM trade is a fade on a soft data reaction toward 54,000, then 53,600 — or simply standing aside and letting NQ carry the long exposure.
Dow Jones (YM) One-Hour Chart, August 5, 2026
Source: TradingView
The Relative-Value Read
Netting it out: if you look at potential longs, express it through NQ pullbacks, where the risk is defined at the retest.
If you want downside or a hedge, YM is the vehicle — extended, unsupported, and the first to mean-revert on a disappointment.
The two are not a pair trade to put on blind, but they do frame a clean if/then: the data at 8:15 and 10:00 ET is the switch that decides which side is live.
Scenario Matrix — Keyed to the 8:15 ADP & 10:00 ISM Prints
| Scenario | Trigger — ADP 8:15 / ISM 10:00 ET | NQ (NQU2026) | YM (YMU2026) |
|---|---|---|---|
| Bull | Soft ADP + in-line/cool ISM prices-paid; Sept-hike odds ease, yields slip | Buy the 29,600 pullback; target 30,000, then measured-move blue sky above 30,050 | Trend intact but chase-risk high; add only on 54,000 dips, do not buy 54,600 |
| Base | Mixed prints, no clean hike signal; tape drifts on earnings | Range 29,600–30,000; buy the retest, trim into 30,000 divergence | Stall 54,400–54,600; scalp only, no fresh swing exposure into Friday NFP |
| Bear | Hot ISM prices-paid (> 67.7 prior); Sept hike re-arms, 10Y pushes back up | Fade the 30,000 divergence to the 29,265 retest; loss of 29,200 opens 28,768 | Mean-revert 54,000 → 53,600; below there the 100-SMA at 53,099 is the magnet |
Retail Trader Positioning - Nasdaq (NQ)
Looking at the Positioning Edge Tool on MarketFramework and traders are leaning heavily into short positions (70% short), expecting the market to exhaust its upward momentum or undergo a mean-reversion pullback.
In contrast, unprofitable traders are chasing the rally late, sitting heavily long (62% long).
For active traders, an Extreme Bearish Divergence like this suggests that buying upside continuation carries poor risk-reward right now, while looking for short entries or tightening stop-losses on long positions aligns with the track record of high-performing market participants.


