
Nasdaq-100 futures have staged a roughly 400-point reversal off the session low to trade near 28,792, and the fuel is unmistakable: Amazon vaulting into the $3 trillion club on a post-earnings surge, dragging the megacap complex up with it. But under the hood the tape is split, and the chart is running straight into a wall.
The question for the desk is whether a narrow, hyperscaler-led bounce can punch through a resistance cluster while momentum is already flashing a warning.
Amazon's $3T Print Does the Heavy Lifting
Amazon crossed $3 trillion in market value for the first time Monday — a record high near $287 and only the fifth company ever to clear the mark. This comes after a Q2 report that reaccelerated the cloud story. Revenue landed at $200.6 billion (+20% YoY), AWS grew 37% (its fastest since 2021) on a reported $496 billion backlog, and management lifted 2026 capex guidance to roughly $220 billion to chase AI demand.
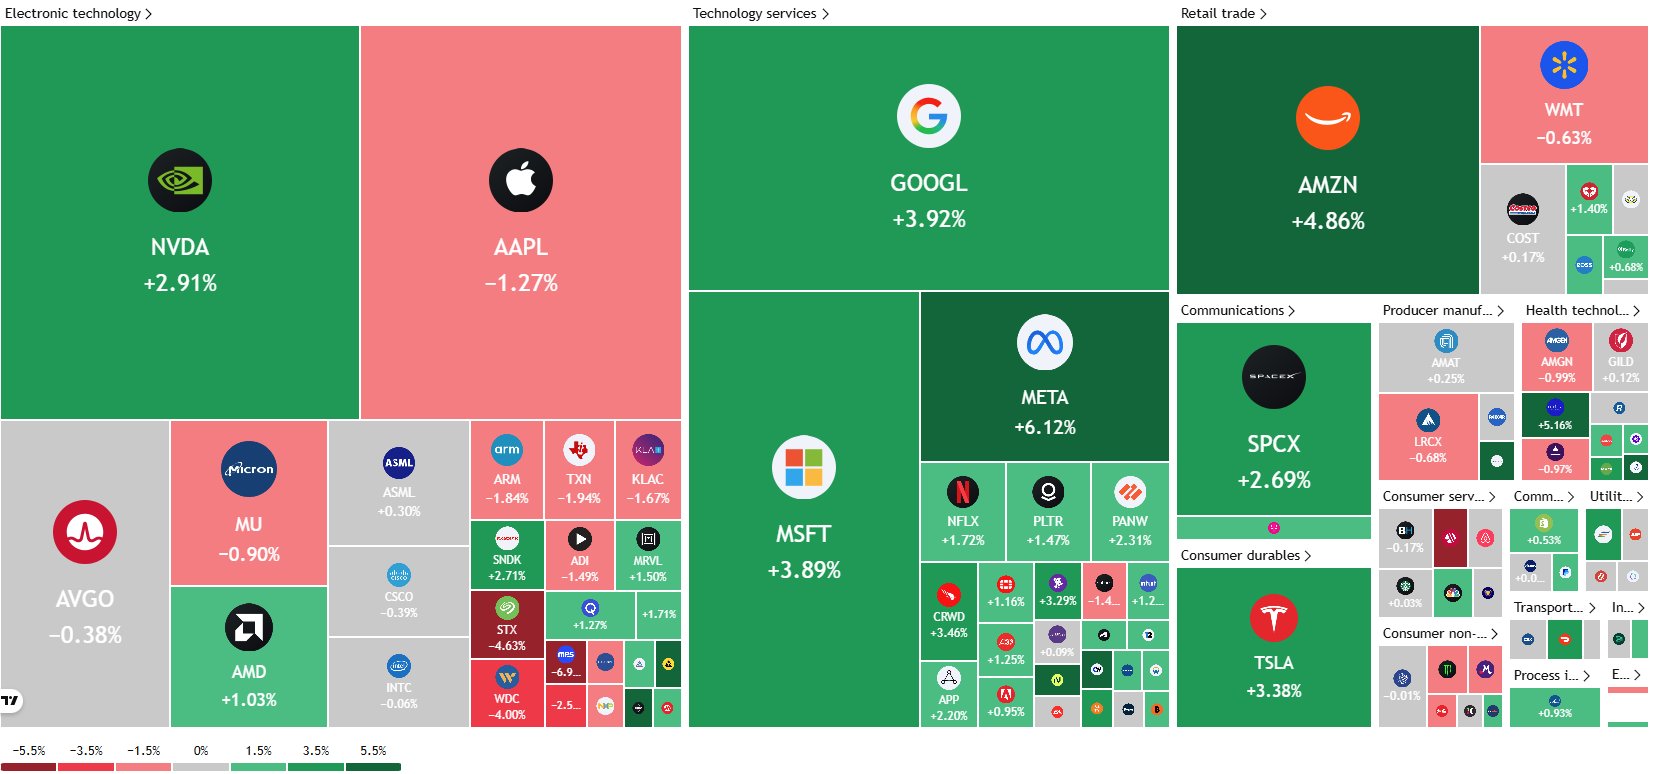
Wall Street chased it too, with Morgan Stanley, JPMorgan and RBC among those raising targets. The read-through matters more than the single name: AMZN, META, GOOGL, MSFT and NVDA are today's index engine.
Nasdaq 100 Heatmap
Source: TradingView
The Tape Underneath is Narrower than the Tape on Top
Here is the catch. The move is hyperscaler-led, not broad.
Apple is red, and the semiconductor complex — the NQ's other load-bearing pillar — is not confirming: AVGO, MU, ARM, TXN and KLAC are all lower, with storage names STX and WDC among the worst on the board.
Zoom out and the rotation is starker still: small-caps and the Dow are out-trading QQQ today, a “catch-up” bid favoring value and industrials over megacap tech.
A rally leaning on four names is a rally with a narrow base.

Created by Zain Vawda Using Canva
Where to Next for the Nasdaq?
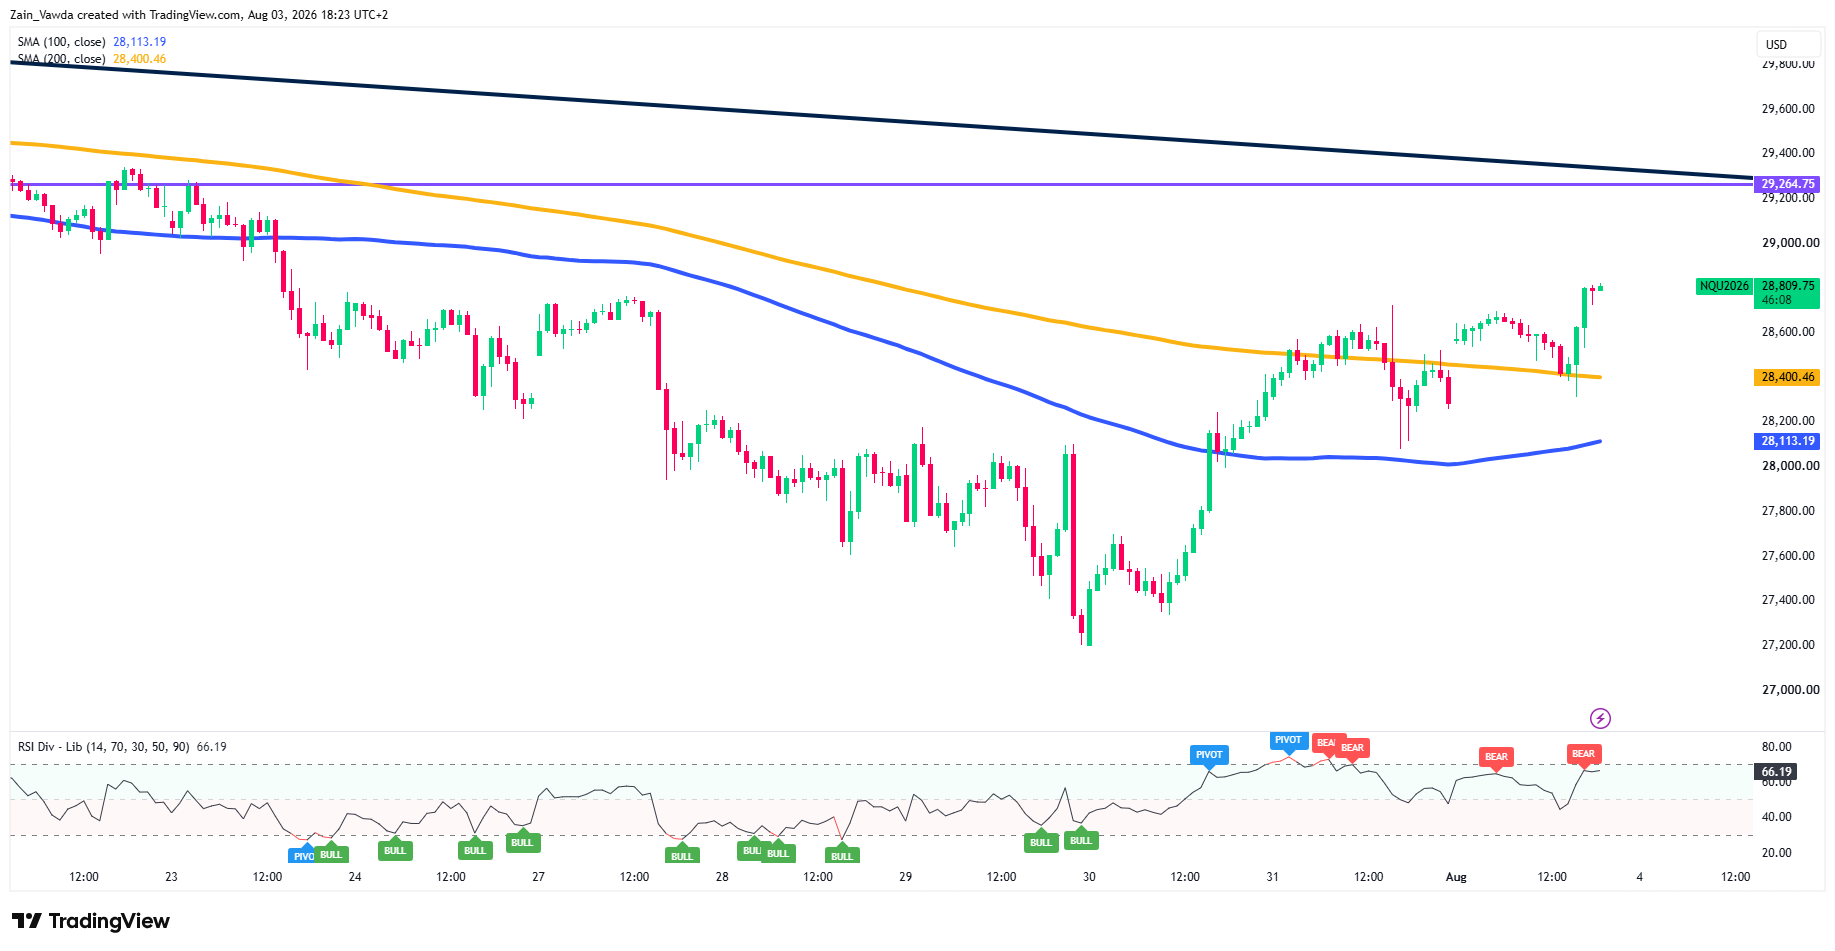
The Nasdaq 100 is pressing session highs near 28,809, holding comfortably above the reclaimed 200-MA at 28,400.46 — the bull's line in the sand.
Nasdaq 100 Index (NQ) One Hour Chart, August 3, 2026
Source: TradingView
Momentum has carried price back to the upper end of the two-week range, but the path higher is congested. The 29,264.75 pivot and the descending trendline off the July 23 high (now ~29,400) cap the advance, while the RSI at 66.19 is still printing a bearish divergence into the push — strength not matched by price.
Bulls need a clean break and hold above 29,264.75 to confirm; failure there risks a fade to the 200-SMA, then the 100-SMA at 28,113.19. Constructive above 28,400, but the burden of proof sits overhead.
Retail Trader Positioning
Looking at retail trader data from the MarketFramework Positioning Edge Tool, it shows 18% divergence between profitable shorts and unprofitable longs which creates an "Extreme Bearish Divergence" signal, indicating potential persistent downward pressure driven by retail trapped longs.


