
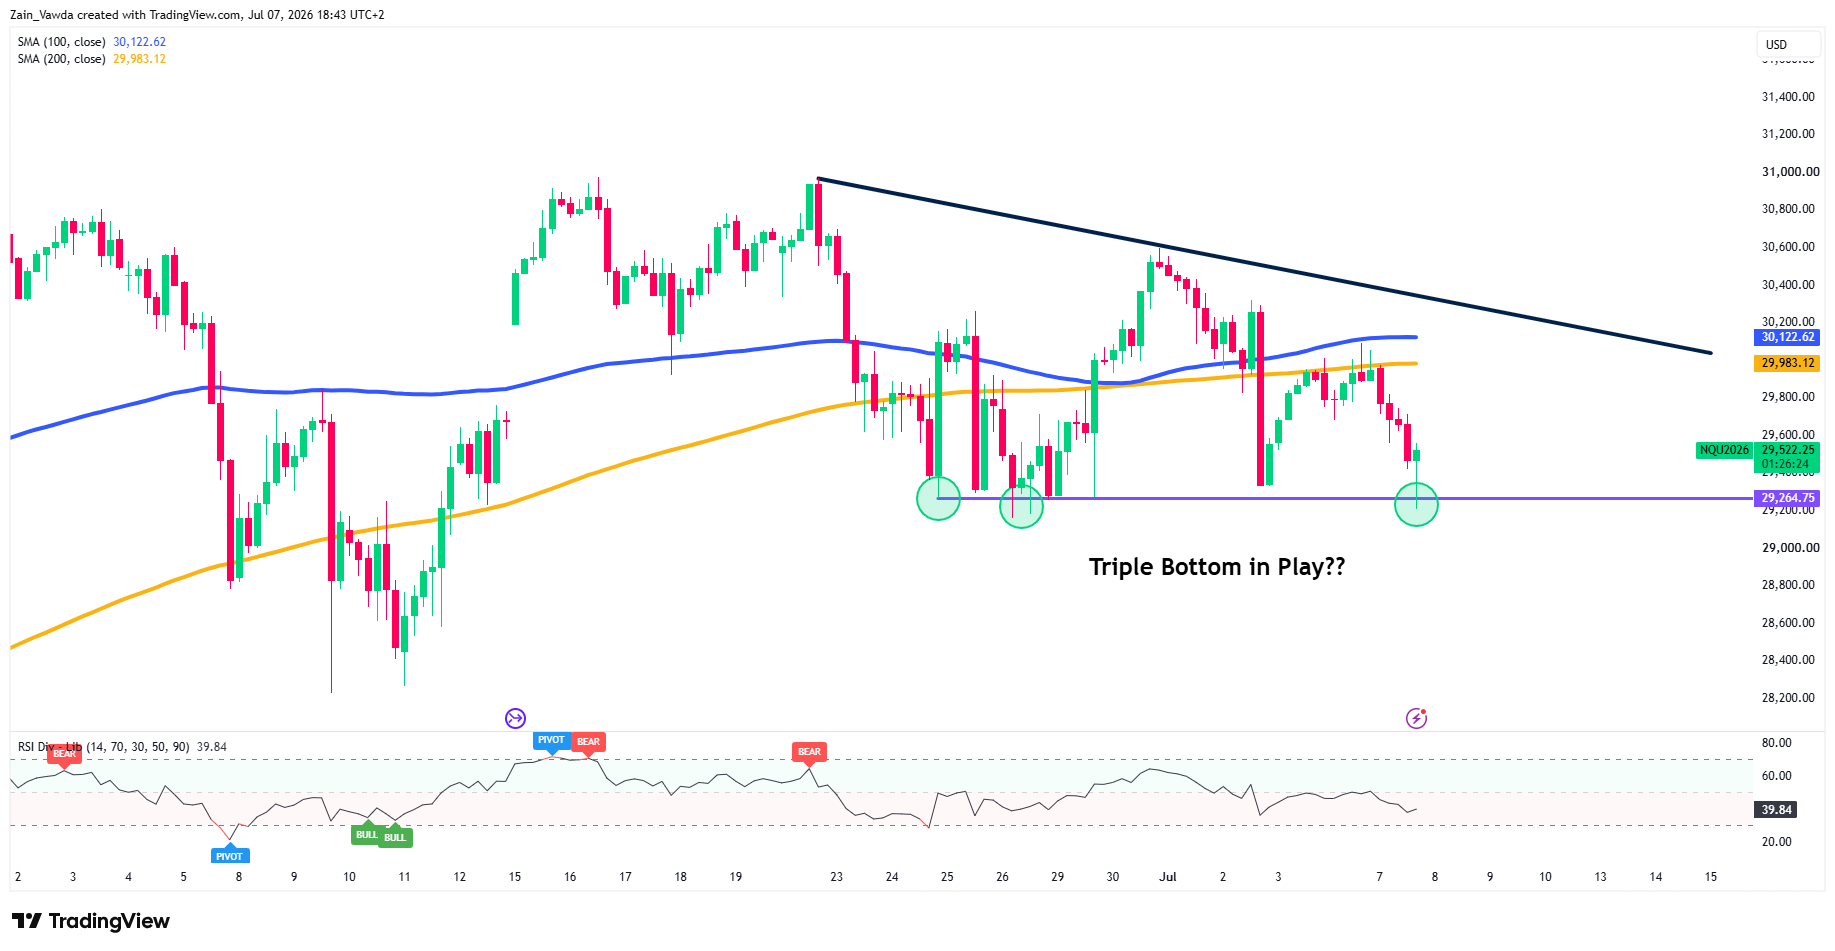
Nasdaq 100 futures (NQ) staged a sharp intraday recovery on Tuesday after a third test of the 29,250 support zone, with the September contract trading back near 29,530.
The bounce keeps the multi-week range intact, but the broader structure remains bearish while price holds below its key moving averages.
H4: Triple Bottom or Third Time Unlucky?
Nasdaq 100 Futures Four-Hour Chart, July 7, 2026
Source: TradingView
The four-hour chart frames the battle.
A descending trendline drawn from the June 22 high near 31,000 continues to cap rallies, and price trades below both the 100-day MA (30,123) and 200-day MA (29,983).
Tuesday’s low marked the third touch of 29,250 since late June, raising the prospect of a triple bottom but the pattern only completes on a break back above the moving-average cluster. A four-hour candle close below the 29,250 handle will invalidate the triple bottom setup.
RSI at 39.8 is soft without being oversold, leaving room in either direction.
H1: 29,689 Is the Line Sellers Are Defending
Nasdaq 100 Futures One-Hour Chart, July 7, 2026
Source: TradingView
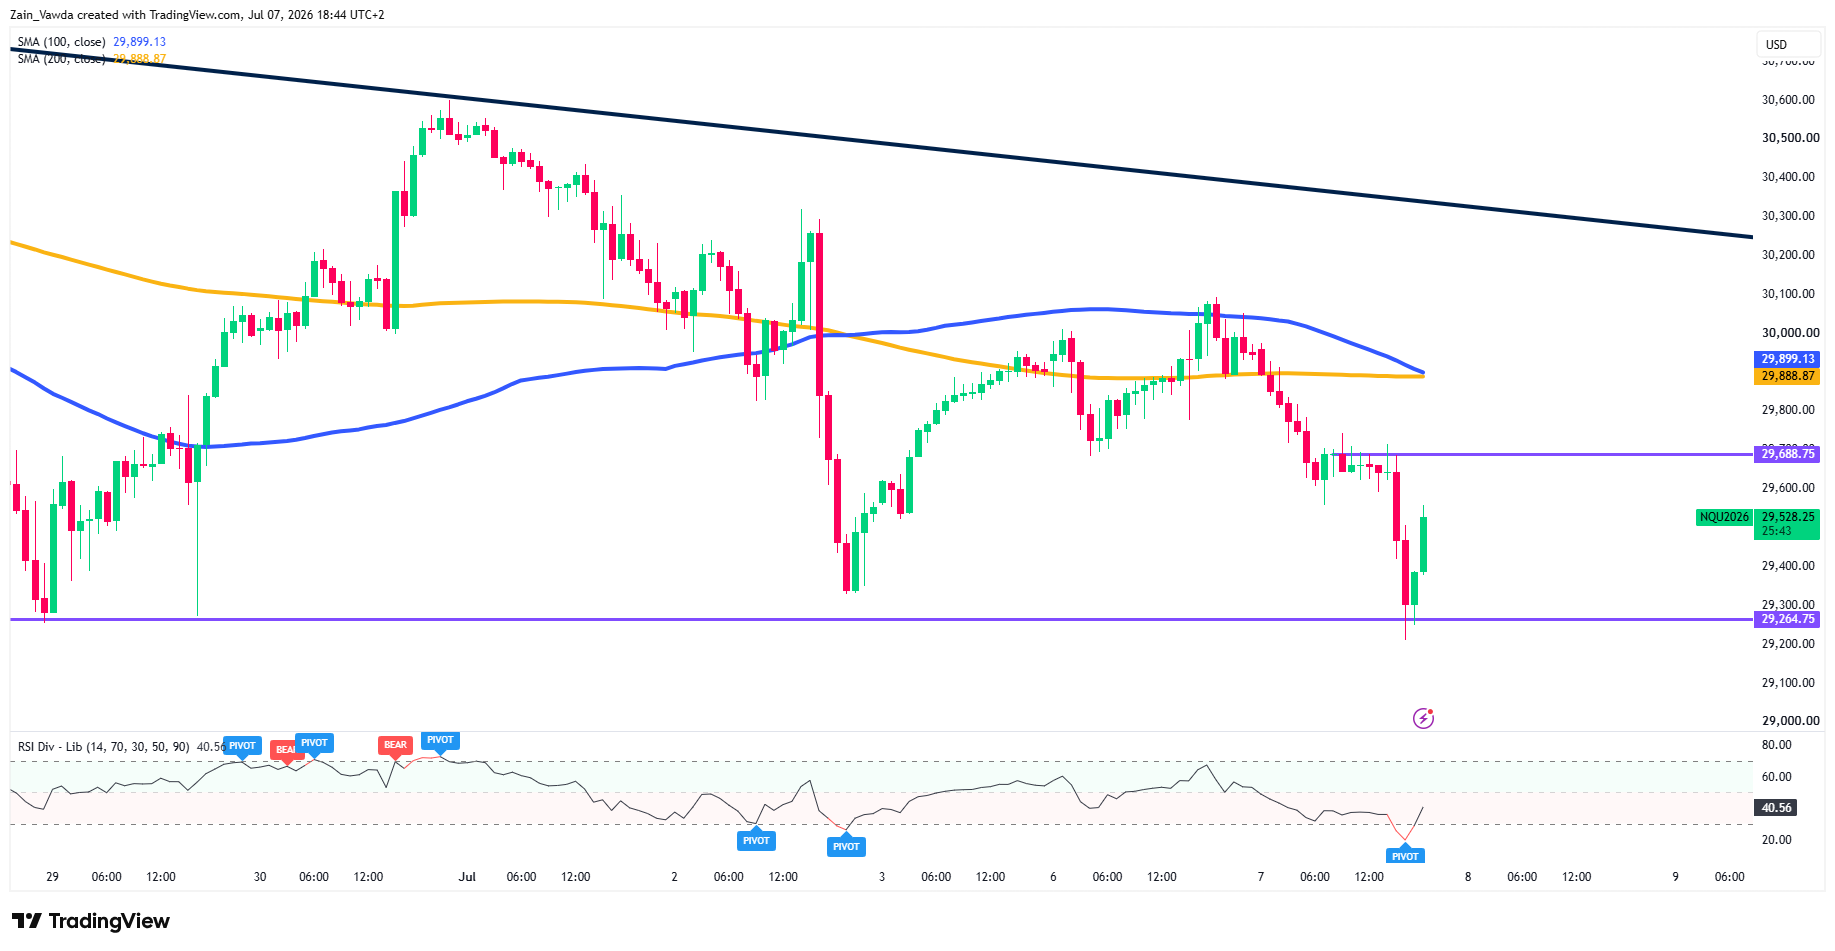
The hourly chart shows a clean sequence of lower highs since June 30.
Former support at 29,688.75 has flipped to first resistance, with the 100- and 200-day MAs converged just above at 29,889–29,899, a natural supply zone for any relief rally.
Hourly RSI printed a pivot low near 20 during the flush and has recovered to around 40, so momentum has reset, but the structure stays bearish while 29,689 caps.
M15: V-Shaped Rejection of the Lows
Nasdaq 100 Futures M15 Chart, July 7, 2026
Source: TradingView
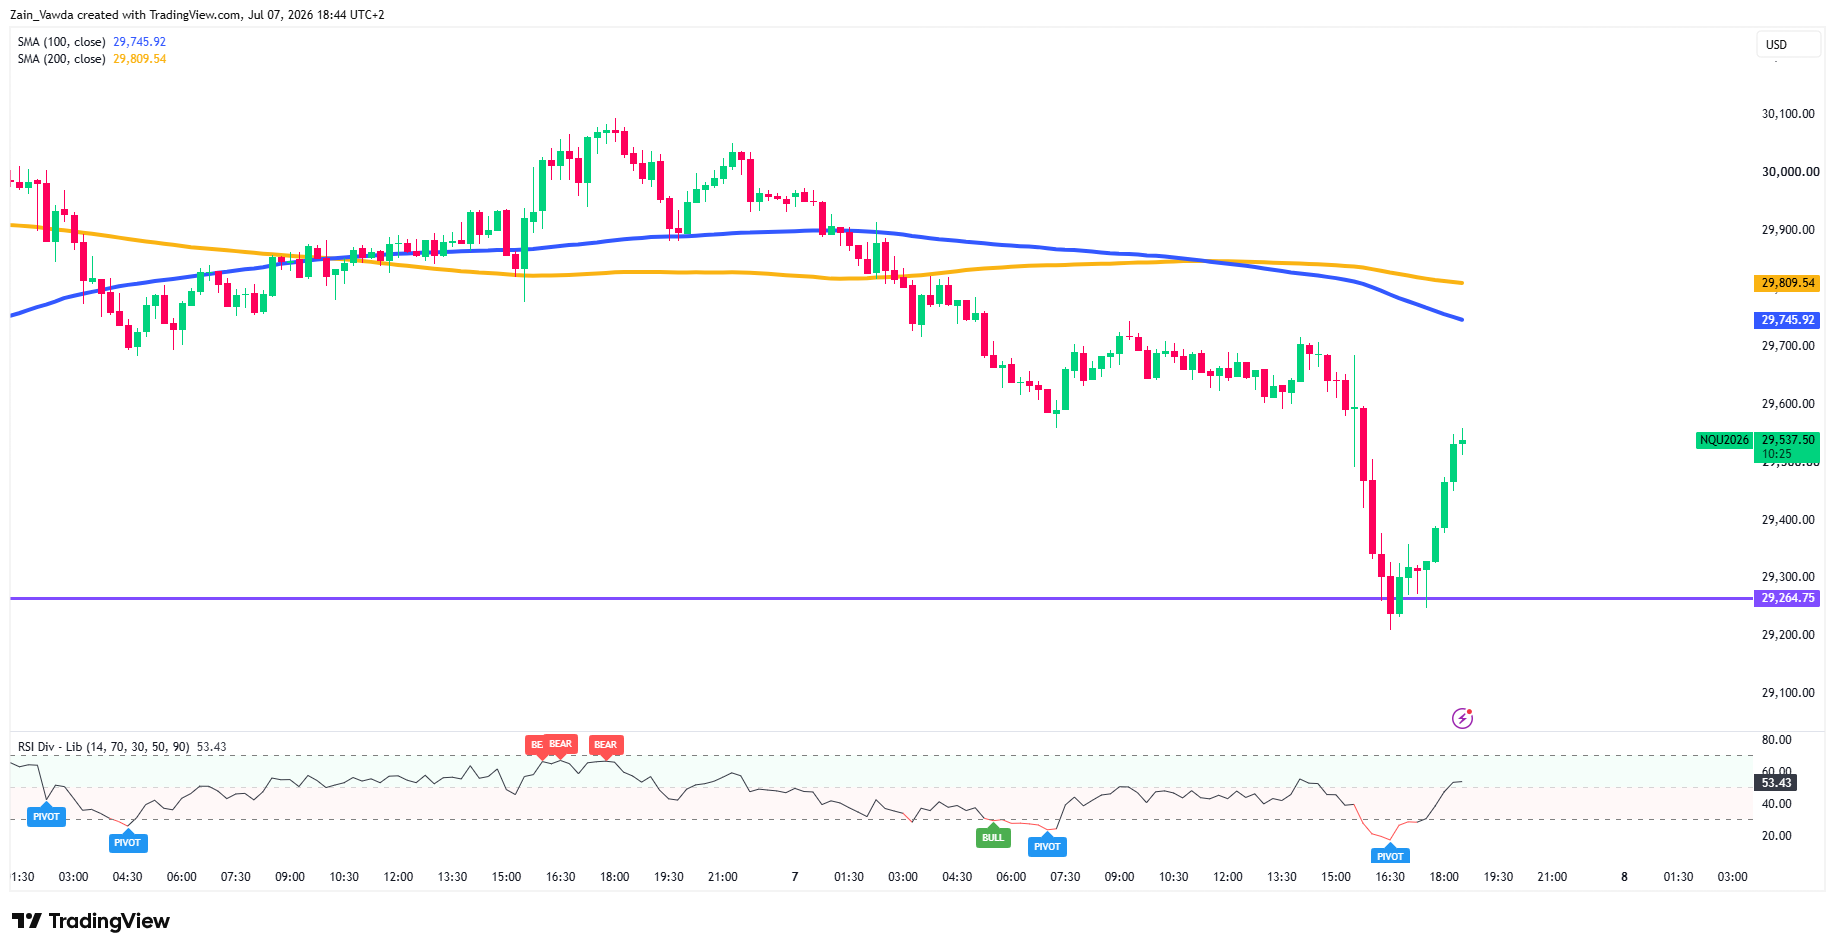
Intraday, the sell-off briefly ran stops below 29,250 to around 29,220 before an aggressive V-shaped recovery of roughly 300 points.
Price is now pressing 29,540 with the 15-minute 100-day MA (29,746) and 200-day MA (29,810) overhead.
RSI at 53 following a bullish pivot gives short-term buyers the edge while 29,600 holds; a slip back under 29,250 would negate the recovery.
Retail Positioning: Winners Are Short, Losers Are Long
Retail positioning data adds a telling layer. Profitable NQ traders are net short at 54%, while unprofitable traders lean long at 53%.
The consistently profitable cohort is aligned with the H4 downtrend, selling rallies into the moving-average cluster.
Crowded losing longs are potential fuel on both sides: a decisive break of 29,250 risks a long-liquidation cascade toward 29,000, while a push through 29,689 could force short covering from the winning camp and accelerate a squeeze into 29,900.
For more up to the minute data, take a look at the trade validator tool.


