
Nasdaq 100 futures (NQ) head into the weekend doing something that looks contradictory until you stack the timeframes up: bouncing on the short-term chart, falling on the medium-term one, and sitting on support on the higher one.
Put all three together and the picture is clean. NQ is caught in a vice, a floor of support just below, and a stack of moving averages piled up overhead.
This is a map of where that squeeze breaks, read from the 4-hour down to the 15-minute.
The 4-Hour Chart: A Pullback That’s Still Holding
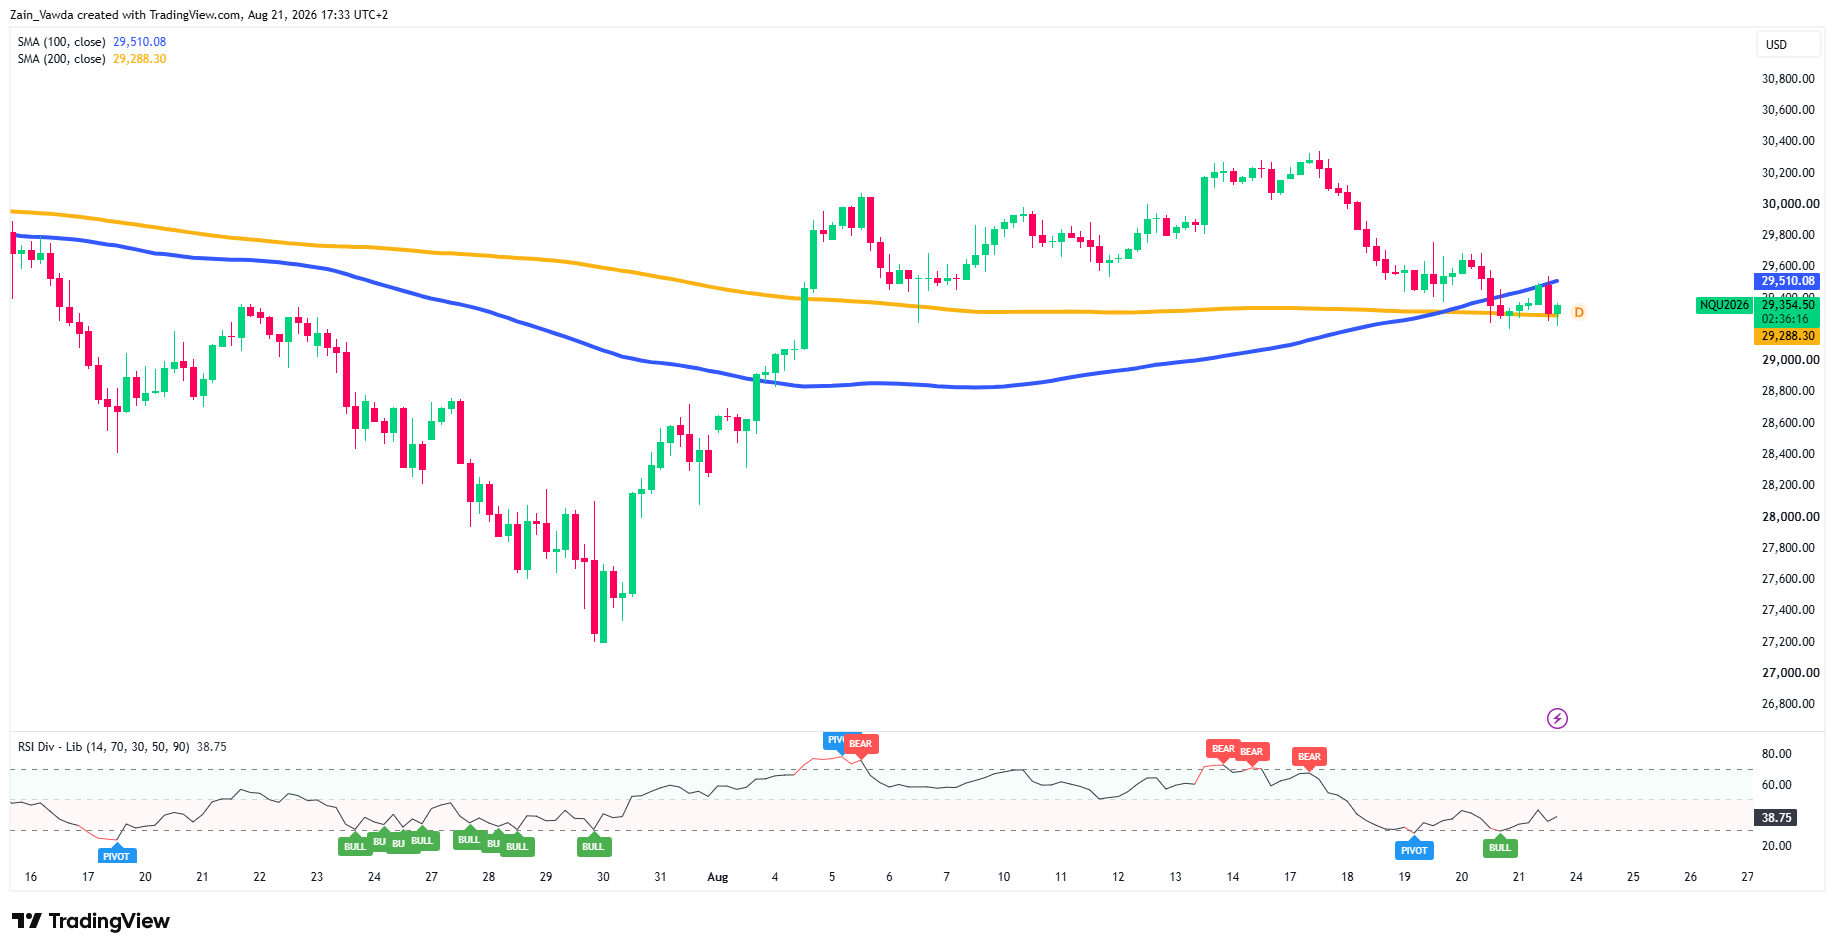
Start with the big picture. Since the late-July low near 27,200, NQ staged a strong recovery to a peak around 30,300 on August 17, then rolled over into this week’s pullback. Price now sits wedged between its two key averages: the 200-bar average at 29,288 is the floor directly beneath, and the 100-bar average at 29,510 is the ceiling directly above.
Nasdaq (NQ) Four-Hour Chart, August 21, 2026
Source: TradingView
The two are only a couple of hundred points apart, the market is compressing. The medium-term uptrend is still technically intact while price holds that 29,288 floor, but it is being tested.
Momentum (RSI) sits below its midpoint near 39, with a fresh bullish flag, a hint the selling is slowing, not a green light.
The 1-Hour Chart: The Bearish One
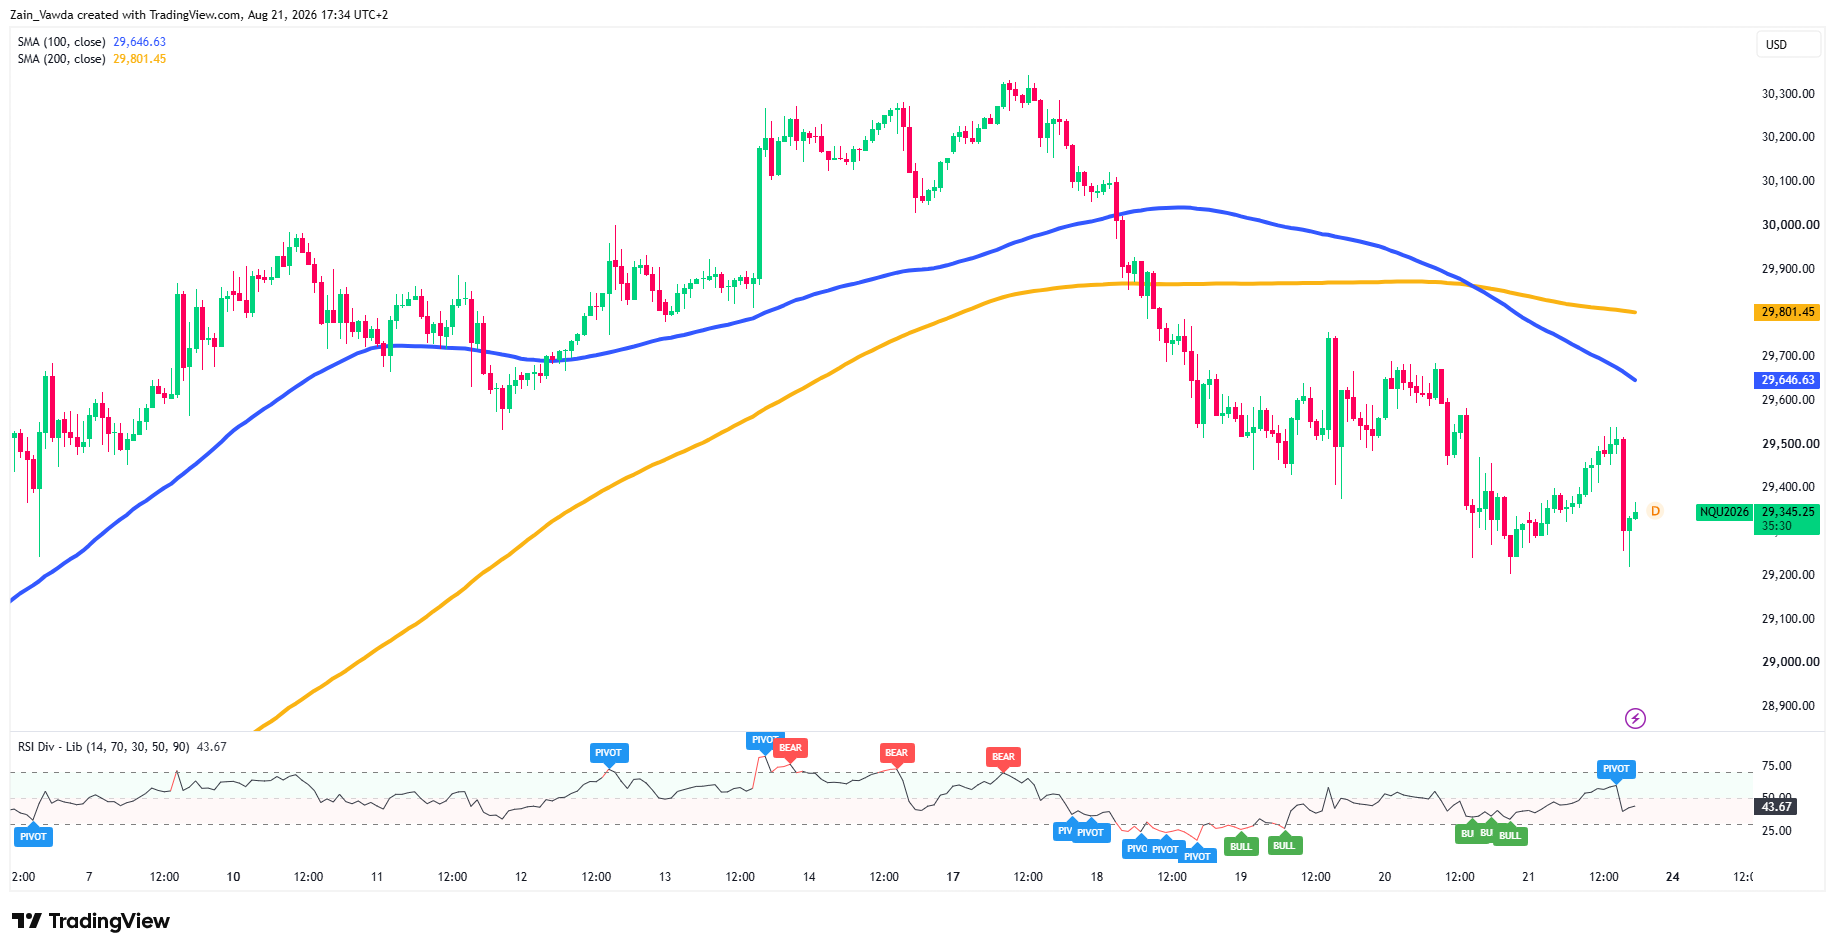
Drop to the 1-hour and the tone hardens. Here price trades below both of its moving averages the 100-bar at 29,646 and the 200-bar at 29,801 and both are now sloping down.
Nasdaq (NQ) One-Hour Chart, August 21, 2026
Source: TradingView
That is the textbook look of a short-term downtrend: a run of lower highs since the August 17 peak, with the averages stacked overhead as resistance rather than support. The 29,650–29,800 band is a supply zone, the area sellers have defended on the way down.
Until price can climb back into it, the 1-hour chart says rallies are there to be sold, not chased.
The 15-Minute Chart: A Bounce Into Resistance
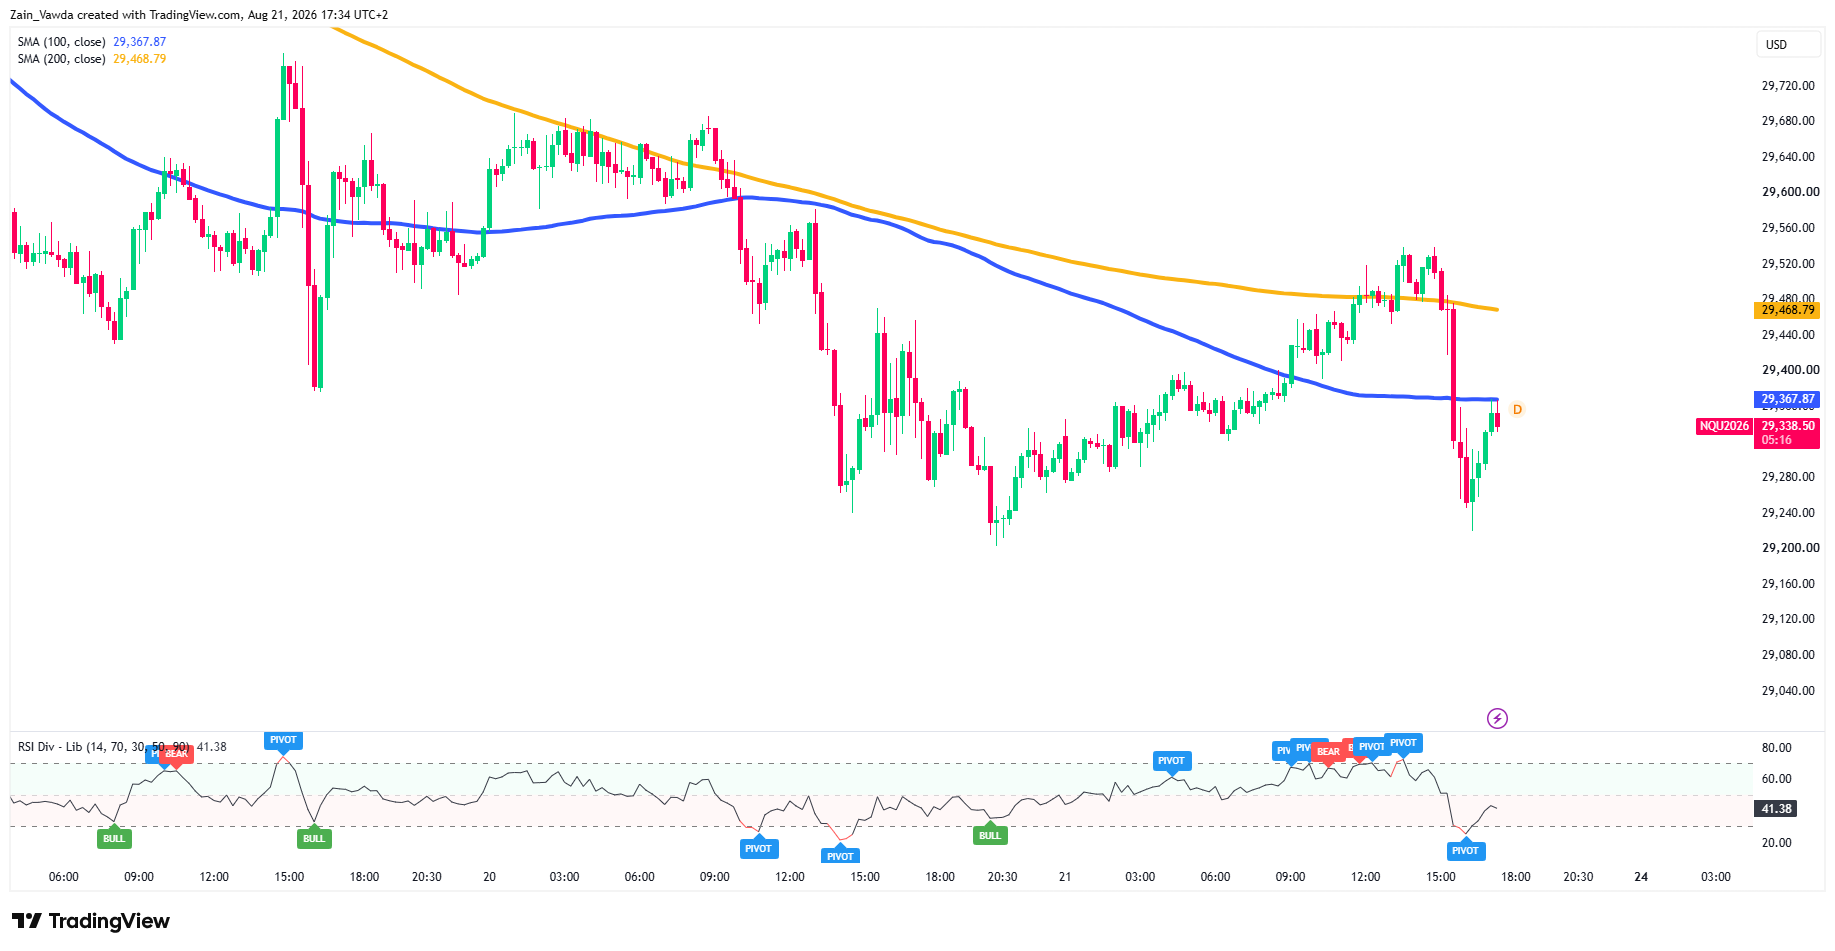
Zoom all the way in and today’s fight shows up in detail. NQ was rejected at its 15-minute 200-average near 29,468 earlier in the session momentum flashed a bearish divergence there (the RSI made a lower high while price pushed up, a sign the move was tiring) then sold off sharply to about 29,200 before buyers stepped in.
Nasdaq (NQ) M15 Chart, August 21, 2026
Source: TradingView
That bounce has carried price back to its 15-minute 100-average near 29,368, the line it is wrestling with now.
Intraday, the range is simple: roughly 29,200 is the floor, roughly 29,468 is the ceiling.
Where the Three Timeframes Agree
Line them up and the disagreement is the message. The 15-minute is bouncing, the 1-hour is bearish, and the 4-hour is holding support which is exactly what a countertrend bounce inside a pullback looks like.
The averages overhead form a ladder: 29,368, then the big one at 29,468–29,510 where the 15-minute 200 and the 4-hour 100 stack together, then 29,646 and 29,801.
That 29,468–29,510 zone is the single most important line on the board. Below it, NQ is capped and the path of least resistance is sideways-to-down; a 4-hour close back above it is what flips the near-term read from “selling rallies” to “recovering.”
On the downside, the floor runs from 29,288 through 29,264.75, a level this desk has flagged before to the 29,200 low.
Lose that shelf on a 4-hour close and the range becomes a deeper leg.
Scenarios From Here
| Scenario | What Triggers It | The Path |
|---|---|---|
| Bull | A 4-hour close back above the 29,468–29,510 wall | Opens 29,646, then the 29,800 supply top; structure flips from 'capped' to 'recovering' |
| Base | Price stays boxed between 29,288 and 29,510 | Range-trade the edges, the stacked averages cap rallies while the 200-average floor holds |
| Bear | A 4-hour close below 29,264.75 / 29,288 | Exposes 29,200; a break there turns the range into a deeper pullback with little support beneath |
Compression like this tends to resolve with force, and next week’s calendar is not a quiet one, so the box is more likely to break than to drift. The charts don’t tell you which way; they tell you the exact lines that will confirm it when it happens
Retail Trader Positioning
NQ shows a strong bearish divergence.
Profitable traders are 59% short vs unprofitable traders at 51% short. This 8% short edge indicates smart money is positioning for downside, treating 29,418 as overhead supply.
Keep an eye on the MarketFramework Positioning Edge Tool for the latest data.


