
Tuesday’s June U.S. CPI report, due at 08:30 ET, is the last inflation reading before the July 28–29 FOMC meeting and it may be the most misleading print of the year.
Consensus expects headline inflation to ease to 3.9% year-over-year, with core steady at 2.9%. Thanks to June’s roughly 20% collapse in oil prices, the month-over-month headline figure could even print negative, something markets haven’t seen in a long time.
The trap is treating that as disinflation. It isn’t. It’s an energy base effect from an oil market that no longer exists.
The weekend’s U.S.–Iran escalation and Tehran’s renewed closure declaration on the Strait of Hormuz have already pushed oil back toward $75, up more than 4% on Monday after a 5.4% weekly gain.
Whatever relief June’s data shows was collected before the strait shut again. July’s energy math is running the other way, and the Fed knows it. The June minutes flagged price pressures becoming broad-based rather than confined to energy, with the hawks clearly holding the upper hand under Chair Kevin Warsh.
What Consensus Expects
| Metric | Consensus | Prior |
|---|---|---|
| Headline CPI (YoY) | 3.8% | 4.2% (May jump) |
| Core CPI (YoY) | 2.9% | 2.9% |
| CPI (MoM) | Potentially negative | Elevated on energy |
| Release | Tuesday, Jul 14 • 08:30 ET | Last print before Jul 29 FOMC |
The Warsh Complication
The release collides with an unusual second catalyst: Warsh delivers his first Humphrey-Hawkins testimony before the House Financial Services Committee the same day, followed by the Senate on Wednesday.
He has been explicit about his discomfort with inflation running above target and his dislike of forward guidance, and markets are still debating whether September or even July is live for a hike.
The danger scenario for rate-sensitive assets is a soft CPI that gets verbally overridden hours later: if Warsh acknowledges renewed energy pressure keeps hikes on the table, the morning’s data reaction could fully unwind by the close.
Potential Scenario Matrix — Catalyst: June CPI + Warsh Testimony, Tuesday July 14
| Case | Trigger | Market Path |
|---|---|---|
| Bull (risk on) | Negative MoM headline, core ≤2.8%, Warsh measured; hike odds fade | Yields drop, DXY off 101, Nasdaq relief rally, gold reclaims $4,100 |
| Base | In-line 3.8%/2.9%; Warsh hawkish but non-committal on July | Two-way chop; oil headlines retake control by Wednesday |
| Bear (Risk-off) | Core ≥3.0% or hot MoM; Warsh keeps July live as Brent climbs | 2yr through 4.30%, EUR/USD tests 1.1324, ES/NQ extend lower |
Dow Jones Technical Outlook
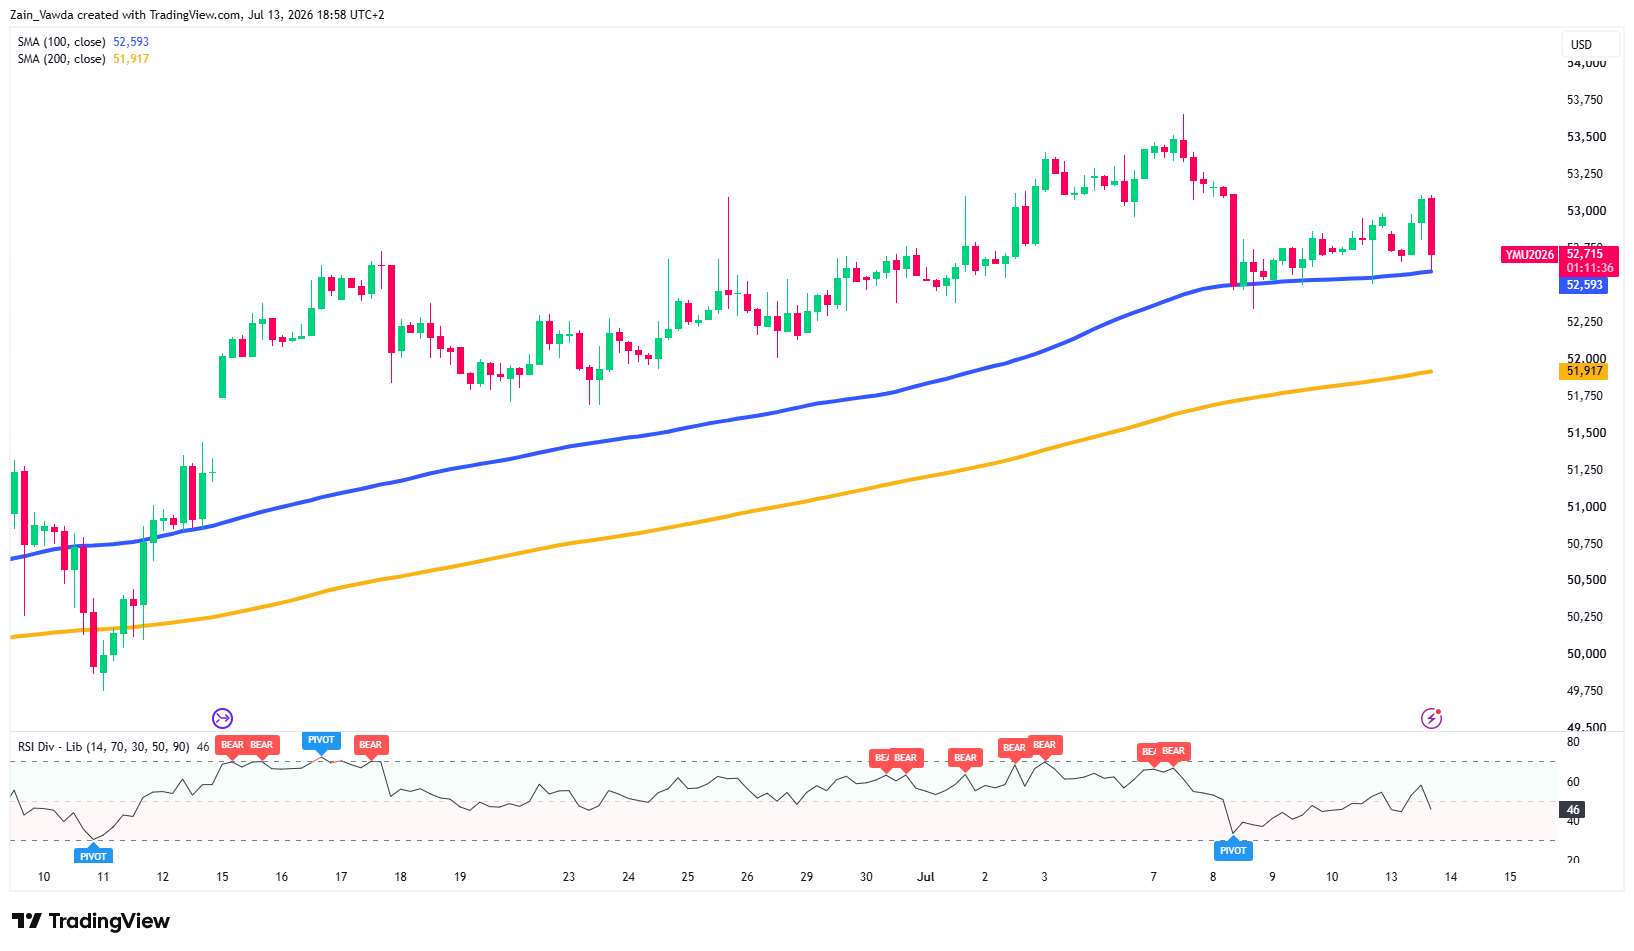
Dow futures remain in a broader uptrend at 52,715, holding above both the rising 100-day MA (52,593) and 200-day MA (51,917), but momentum is deteriorating.
Dow Jones Four-Hour Chart, July 13, 2026
Source: TradingView
Repeated bearish RSI divergences marked the advance into the 53,600 peak, and the sharp July 8 selloff found buyers precisely at the 100 MA, now the key line in the sand.
The recovery since has stalled near 53,000–53,100 carving out a potential lower high.
RSI at 46 sits below midline, confirming fading upside impulse.
A daily close below 52,590 would expose 52,250 and the 200 MA, while bulls need a push through 53,100 to reopen the path toward the recent highs.


