Something looks off on the gold chart this week.
Oil has just pushed back above $100 a barrel after U.S. strikes on Iranian tankers and attacks on Saudi oil facilities, exactly the kind of war headline that, in any normal cycle, sends gold flying.
Instead gold (GC / XAU/USD) is fading, continuing a trend we have seen since the start of the U.S.-Iran. It is churning in the mid-$4,300s to around $4,420, unable to reclaim $4,500.
A shooting war is escalating and the safe-haven metal remains without a bid.
The War Is Hitting Gold With The Wrong Sign
The war premium market participants usually expect when it comes to Gold is flowing via a rise in inflation expectations. As U.S. yields remain elevated and the probability of a interest rate hike at the Federal Reserve's Sept. 15-16 meeting remains above 50%, gold may continue to feel the heat.
Put simply: gold is not ignoring the war. It is reading it correctly. Right now the war is an inflation event, and inflation is gold's enemy.
What the charts Say
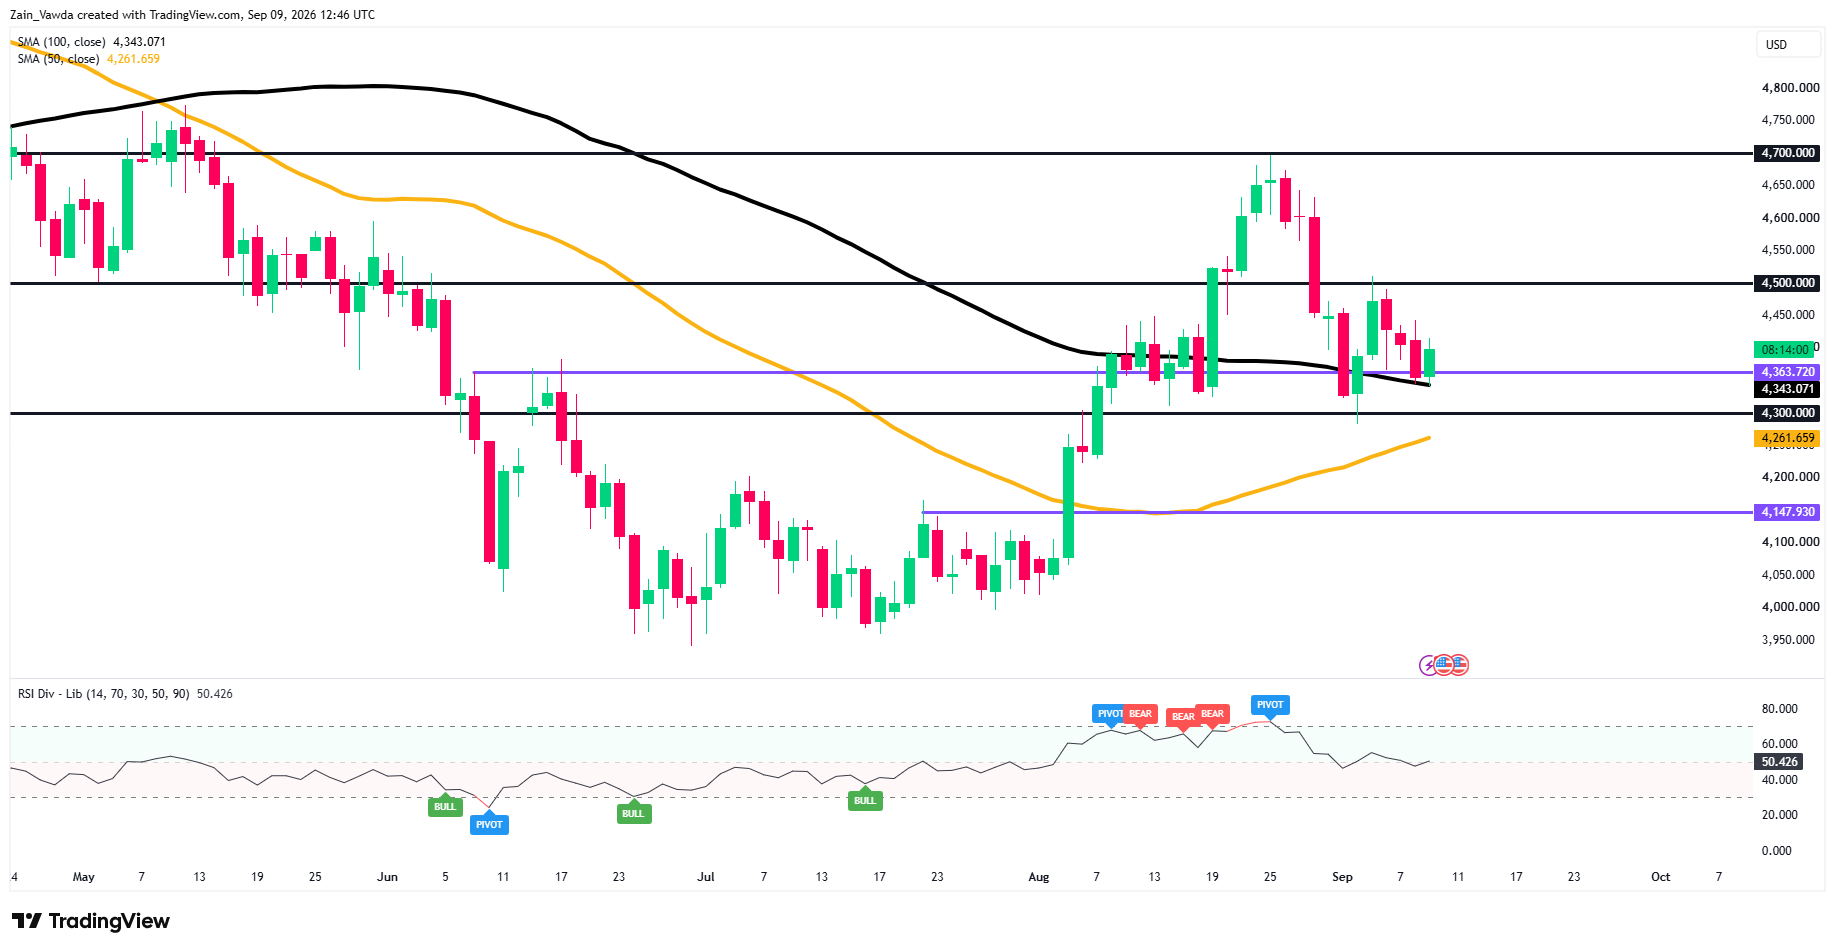
On the higher timeframe (Daily and H4), gold is pinned at a decision point: the $4,363 shelf sits right on top of the 100-period moving average near $4,343.
Hold that zone and the churn continues; lose it and the picture turns lower.
Gold Daily Chart, September 9, 2026
Source: TradingView
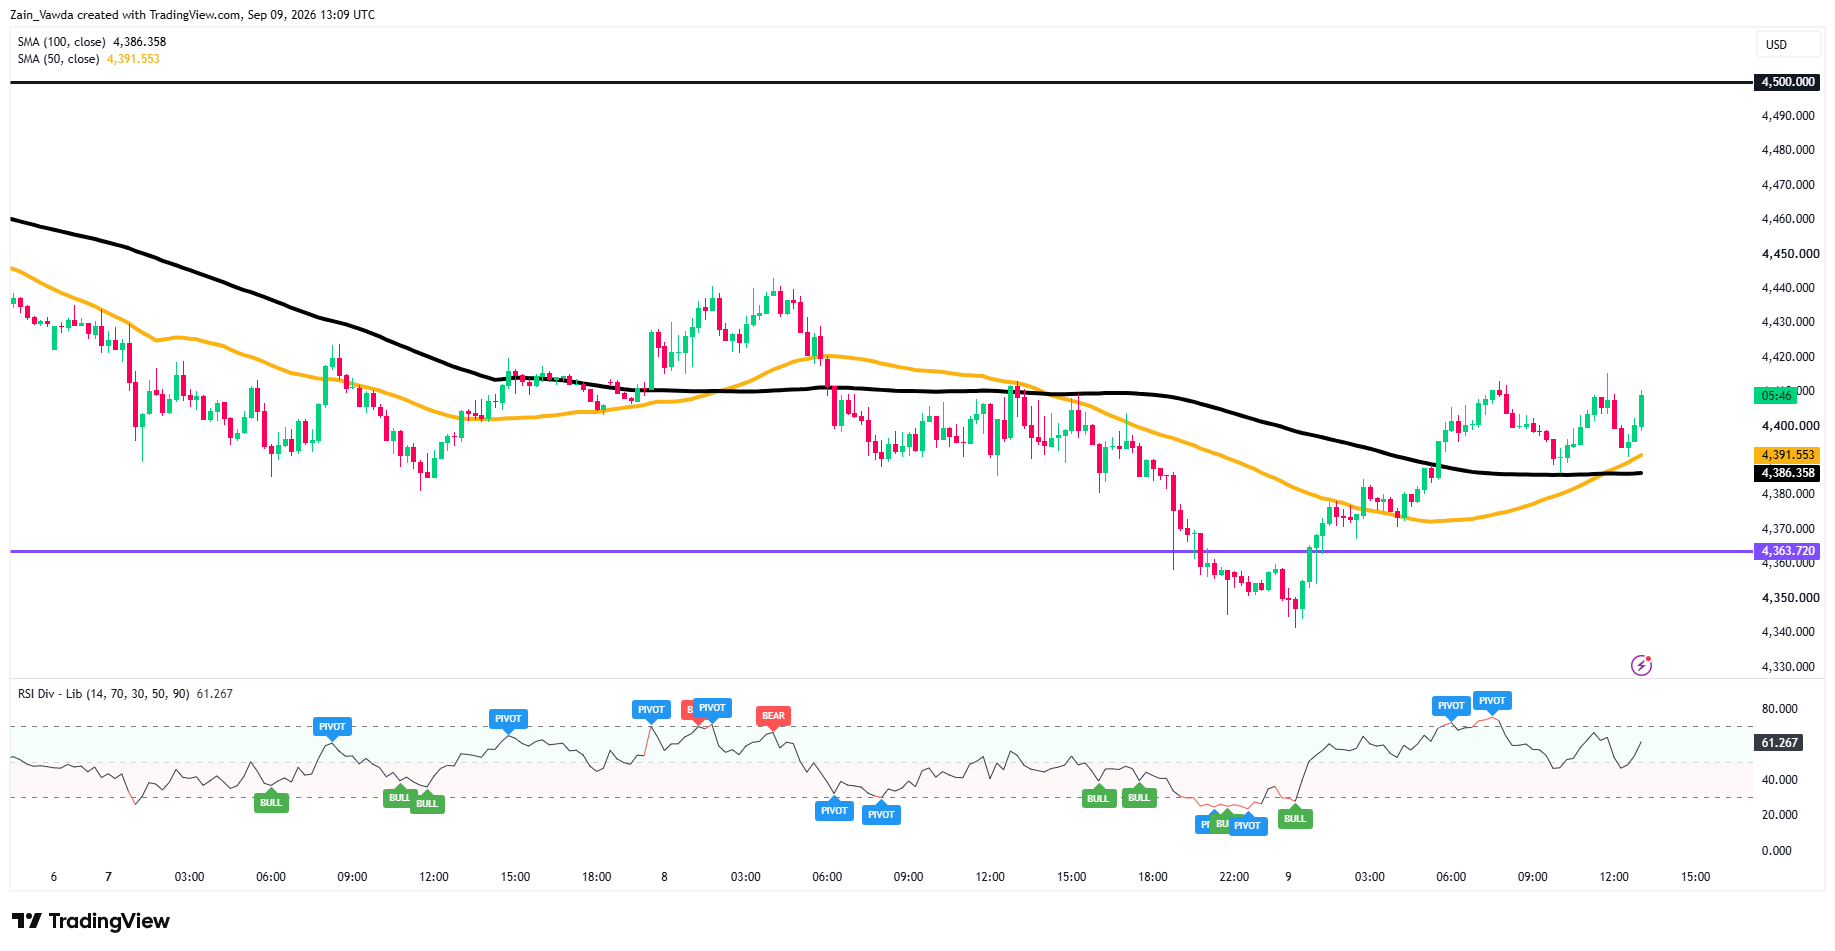
For a more immediate view we look at the M15 gold chart which is grinding higher near 4,405 after reclaiming both the 50- and 100-MAs (4,391/4,386) which have flattened and converged, a sign the earlier downtrend has stalled into balance.
The bounce off the 4,363.72 shelf (yesterday's 4,343 low held it) is now three legs old, with RSI at 61 and holding above 50, momentum favours buyers short-term.
4,420 is the immediate hurdle; a clean break targets the 4,500 ceiling. Support stacks at the 4,386–4,391 average cluster, then 4,363.72. Losing that shelf reopens 4,343.
Gold M15 Chart, September 9, 2026
Source: TradingView
The Bid Comes Back On Rates, Not Rockets
Here is the counter-intuitive part. What revives gold from here probably is not more war, it is softer inflation.
This is the mirror image of the “peace-trade paradox” the desk has written about, where gold rallies when tensions cool because yields fall.
The nearest catalyst is Friday's CPI, the main U.S. inflation report. A cool number would ease rate-hike bets and pull yields down, and that, not another Hormuz headline, is what hands gold its bid back.
A hot number does the opposite.
Trader Positioning Data
Profitable traders sit 50% long / 50% short, balanced, no conviction while unprofitable traders are 75% long, a full 25 points more crowded on the long side.
That gap, flagged as an extreme bearish divergence, is the tell: the losing crowd is leaning into the bounce just as it stalls near resistance.
The 4H trend of profitable traders trimming longs while the unprofitable pile in supports fading strength into 4,420–4,500 rather than chasing it.
Keep an eye on how positioning may evolve using the MarketFramework Positioning Edge Tool and gauge where the smart money is flowing.


