
Gold (XAU/USD) saw a sharp pullback during Tuesday’s European trading session after testing the key psychological $4,700 mark and reaching a multi-week high near $4,697.
A modest recovery in the U.S. dollar alongside rising Treasury yields triggered profit-taking, dragging spot prices back toward the $4,635 region.
However, despite the intraday retracement, gold’s overarching technical structure and broader market momentum remain firmly bullish.
Fundamental Drivers: Dollar Recovery vs. Structural Demand
The primary catalyst behind Tuesday’s pullback was a surge in the U.S. dollar Index (DXY) accompanied by a rebound in U.S. Treasury bond yields. Fresh U.S. sanctions related to Iran saw market participants eye a potential rise in Oil prices, which has not materialized.
Profit taking is another option that could have contributed to the selloff.
Higher yields and a firmer dollar elevated the opportunity cost of holding non-yielding bullion, inducing a pullback of nearly $70 from intraday highs.
Despite this corrective move, fundamental support for the precious metal remains intact:
- Central Bank & Institutional Accumulation: Strong institutional demand from Asia continues to underpin prices, with gold open interest on the Shanghai Futures Exchange (SHFE) hovering near historical highs.
- Dovish Fed Expectations: Markets continue to price out further Federal Reserve rate hikes, capping prolonged upside momentum for U.S. yields.
- Macro & Geopolitical Risks: Ongoing geopolitical tensions keep baseline safe-haven interest elevated across global markets.
Institutional buyers are also arriving in numbers. Fidelity International portfolio manager George Efstathopoulos has doubled his fund’s gold holdings over the past 3 weeks, reaching a self-imposed 5% allocation limit, citing what he calls a lack of Federal Reserve credibility and rising policy uncertainty.
Moreover, gold ETFs added 18 tonnes on Thursday August 20th alone, the largest single-day increase since September 2025, marking a 5th consecutive week of inflows.
Central banks, fund managers, and retail investors all appear to be gold buyers once more.
Technical Analysis: H1 & H4 Chart Breakdown
From a technical standpoint, today’s decline serves to relieve overbought condition signals without damaging the broader macro uptrend.
H1 Chart Structure
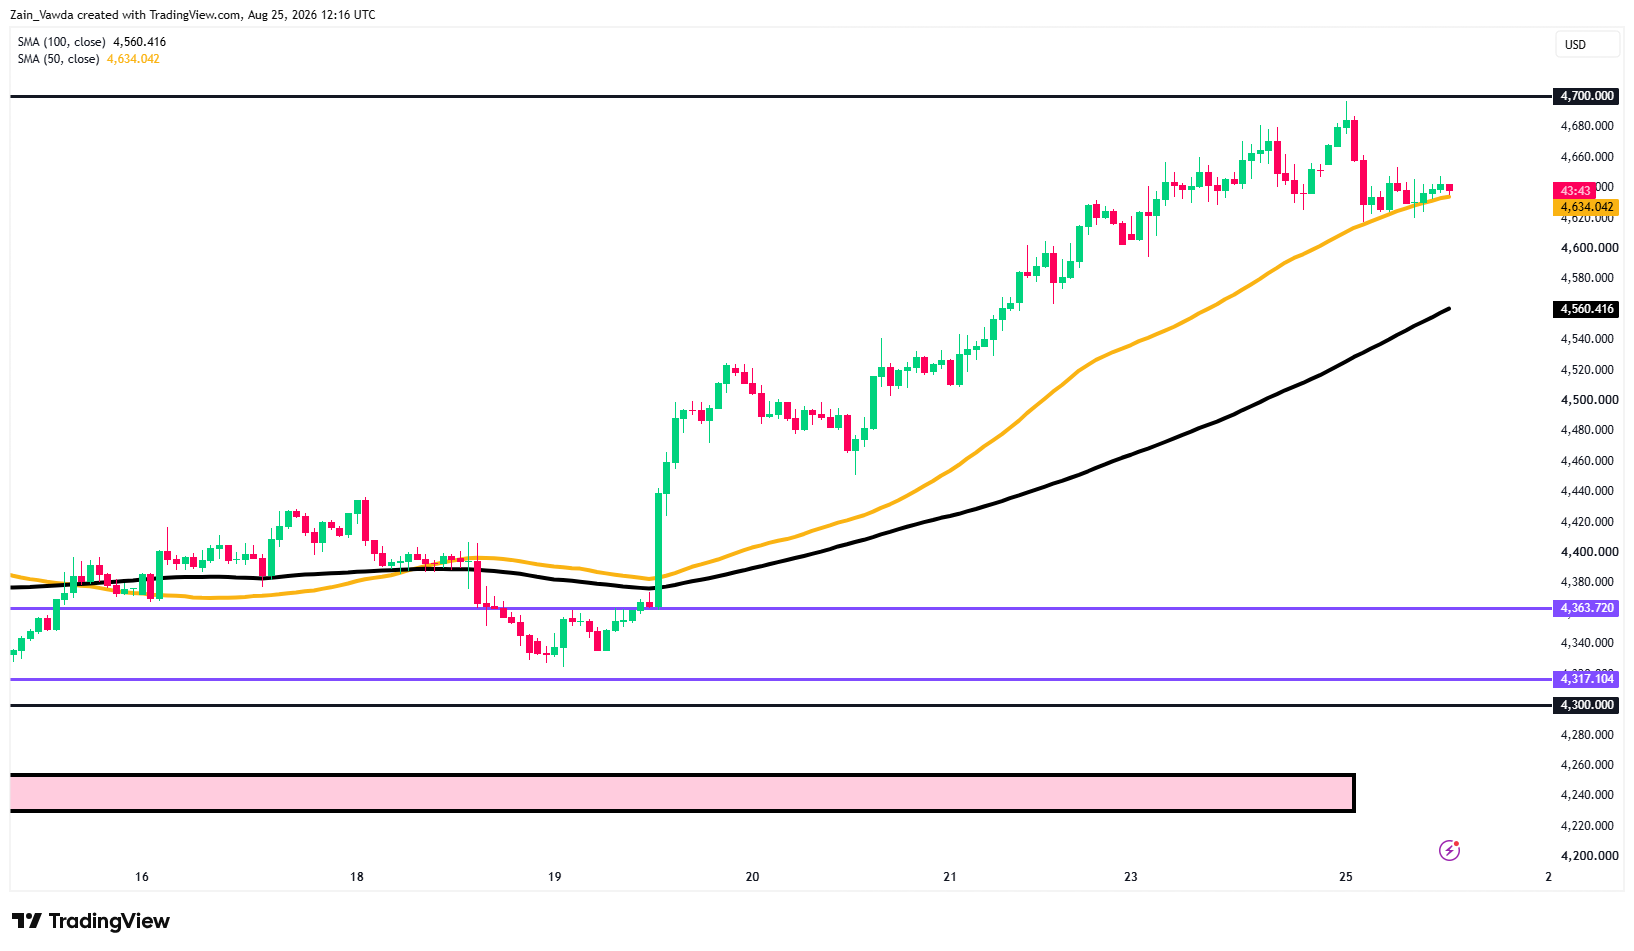
On the 1-hour chart, gold pulled directly back into key dynamic support at the 50-period MA ($4,634.04), where buyers have begun stepping in to stabilize price action.
- Immediate Support: Holding above $4,634 maintains the short-term intraday base.
- Secondary Support: A breach below $4,634 would open the door toward the 100-period MA at $4,560.42.
Gold (XAU/USD) One-Hour Chart, August 25, 2026
Source: TradingView
H4 Chart Structure
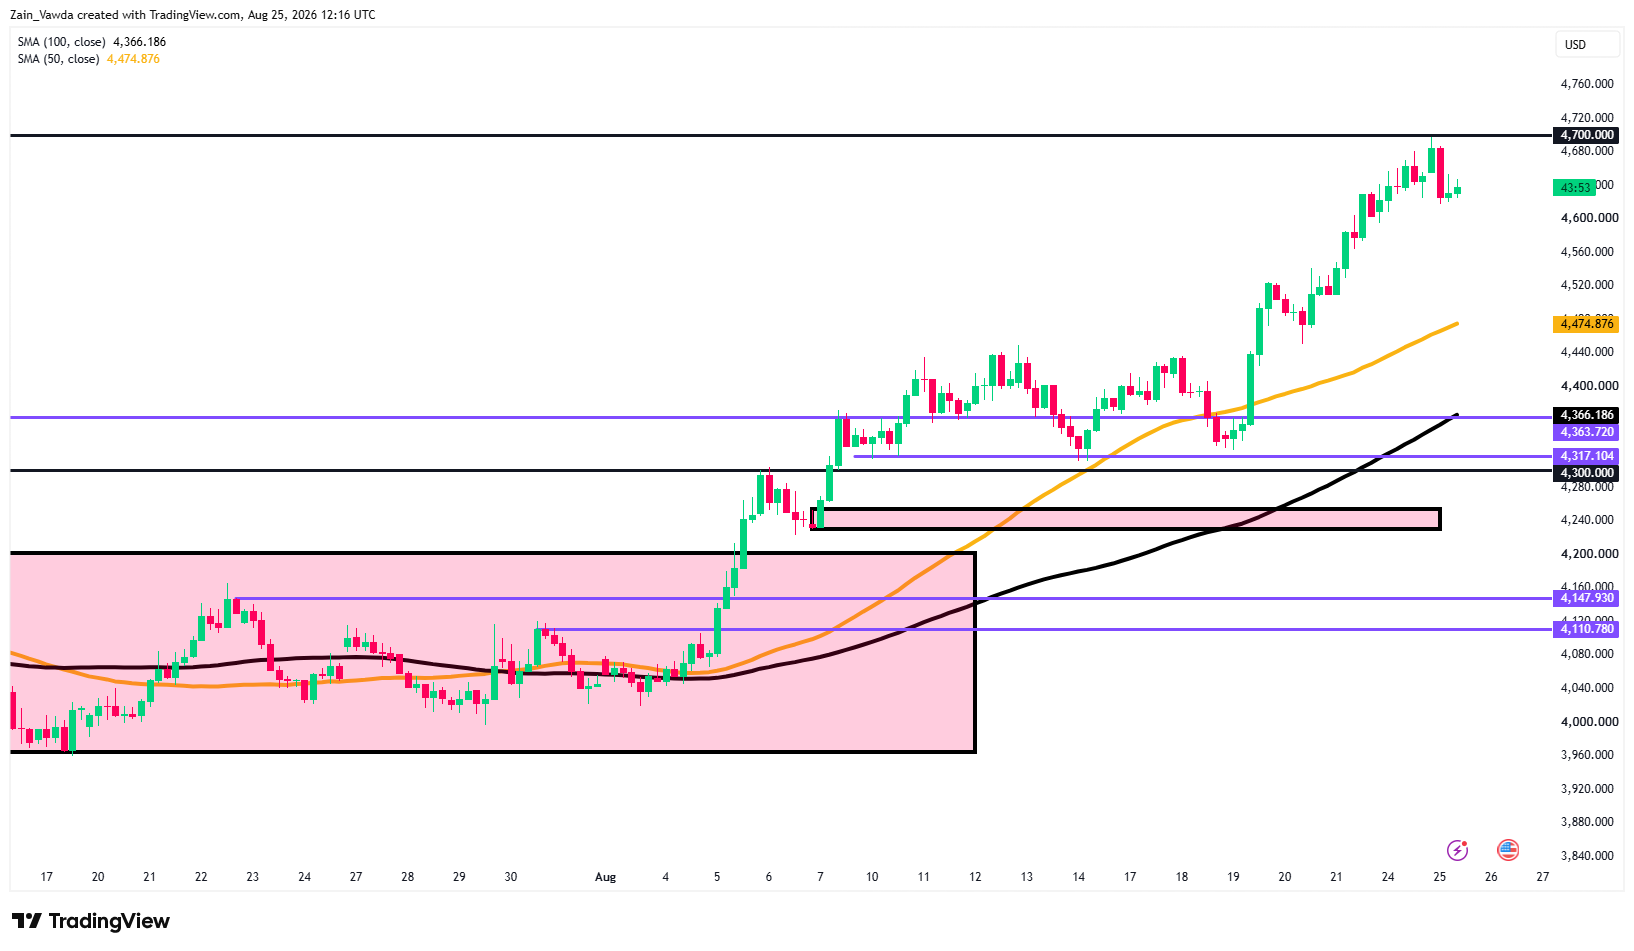
The 4-hour timeframe highlights an intact macro bullish trend sequence. Price trades well above both the 50-period MA ($4,474.88) and the 100-period MA ($4,366.19). The dominant structural resistance ceiling sits at $4,700.00. The current pullback appears to be a healthy correction, allowing indicators to reset before the next directional leg.
Gold (XAU/USD) Four-Hour Chart, August 25, 2026
Source: TradingView
Key Technical Levels to Watch
Resistance Levels:
- $4,680.00 – Intraday high zone / immediate resistance.
- $4,700.00 – Major psychological resistance ceiling.
Support Levels:
- $4,634.00 – H1 50-period SMA / immediate dynamic support.
- $4,560.40 – H1 100-period SMA / secondary support.
- $4,474.88 – H4 50-period SMA / major trend support.
- $4,363.72 – $4,366.19 – Horizontal key support and H4 100-period SMA confluence.
24-Hour Outlook: Scenarios to Consider
Over the next 24 hours, price behavior around the $4,634 support zone will determine short-term direction:
- Bullish Scenario: If buyers hold the $4,634 50-SMA area on the H1 chart and push price back above $4,650, expect another attempt toward $4,680, followed by a renewed test of the $4,700 barrier. A sustained break above $4,700 signals a continuation toward new highs.
- Bearish / Corrective Scenario: A decisive H1 breakdown beneath $4,634 could accelerate profit-taking, driving a deeper correction toward $4,580 and the $4,560 zone (H1 100 SMA).
As long as gold remains above the $4,560 support zone, the broader path of least resistance remains upward, with corrective dips likely to attract buyers seeking value within the macro bull trend.


