
The Breakout That Changed the Structure
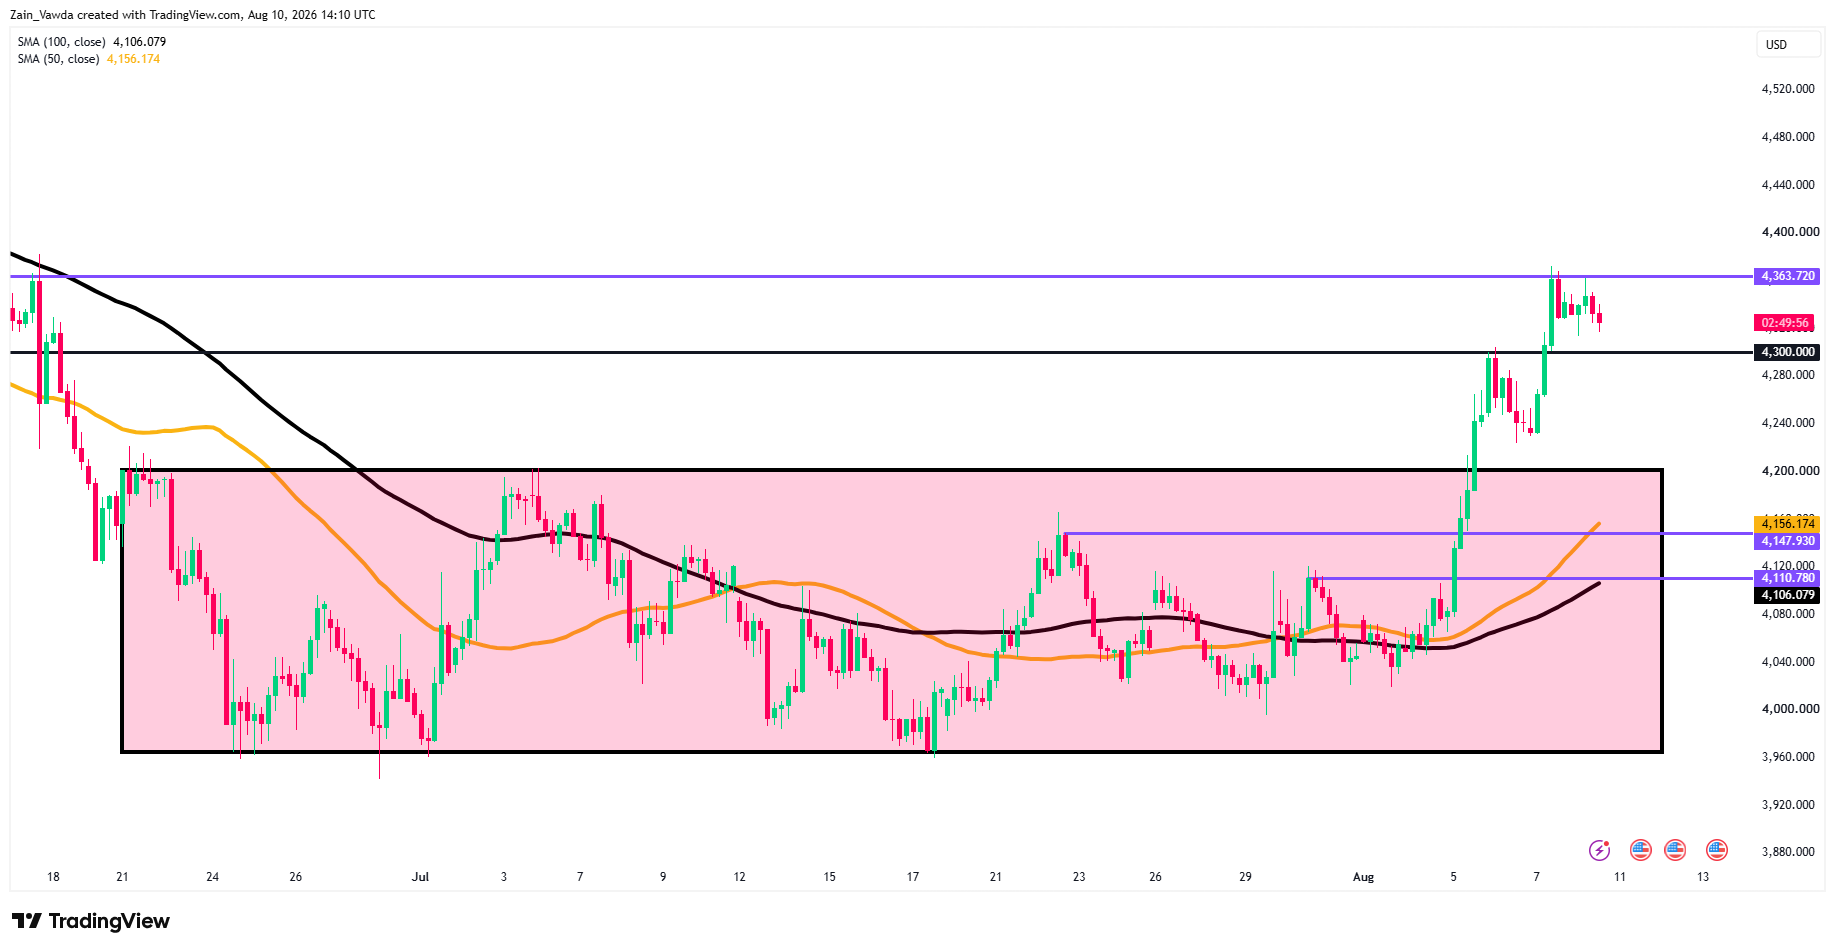
Gold spent six weeks trapped in a 3,960–4,200 coil that defined July.
Last week it resolved decisively higher, clearing the entire range in a near-vertical run that tagged 4,363.72, the mid-June swing high, before stalling. That level is the barrier the whole move now hinges on.
Above it, little stands between spot and the June high near 4,541; below it, the tape has drifted lower for two sessions, and the question has flipped from “how high” to “does the breakout hold.”
Price is consolidating just above 4,350, digesting the run rather than reversing it — for now.
The Pillar Swap: Oil Out, Labour In
Here is the wrinkle that makes today’s setup different from last week’s.
Gold’s breakout was built on the peace-trade paradox: fading Strait of Hormuz risk crashed crude, which drained inflation and hike expectations, and cheaper money is pure oxygen for a non-yielding asset. But that oil pillar has now reversed — Oil is back near $79 and Brent above $84, bid for a third straight session as Hormuz reopening hopes fade and Houthi strikes hit Saudi and UAE assets.
In isolation, a re-bid crude is a headwind for gold through the inflation-then-hike channel. What is holding the metal up is a fresh, second pillar: Friday’s −23k payrolls shock collapsed September hike odds from roughly 67% to the low-40s and pinned yields lower.
The rate support simply changed sponsors — from oil to the labour market — which is why gold is coiling near its highs instead of unwinding the breakout.
Multi-Timeframe Read: H4, H1, M15
Spot Gold Four-Hour Chart, August 10, 2026
Source: TradingView
H4 — unambiguously bullish: price cleared the six-week box, the 50-SMA (4,156) has crossed above the 100-SMA (4,106), and both are rising beneath a rising market — textbook breakout structure, with 4,300 now the pivot.
Spot Gold One-Hour Chart, August 10, 2026
Source: TradingView
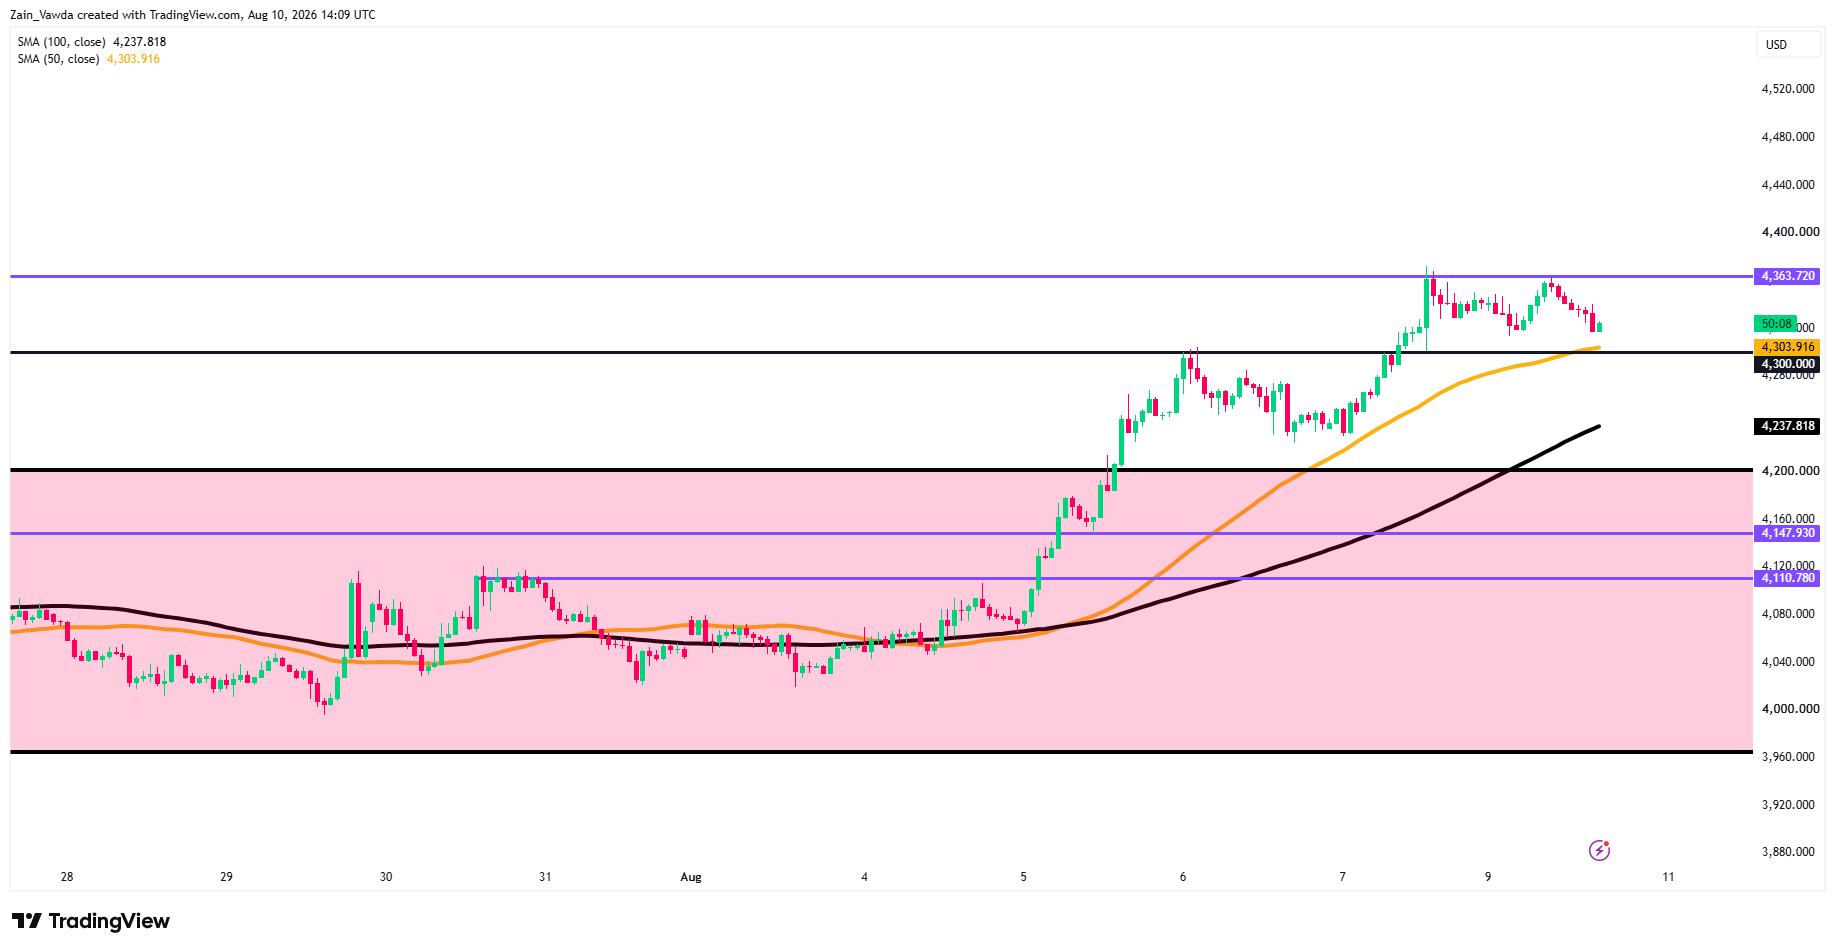
H1 — momentum is cooling: the rejection off 4,363.72 has price back-testing the 50-SMA at 4,303.92, which lines up almost exactly with the 4,300 horizontal — the near-term bull line. Lose it on a closing basis and the H1 100-SMA at 4,237.82 becomes the next magnet.
Spot Gold M15 Chart, August 10, 2026
Source: TradingView
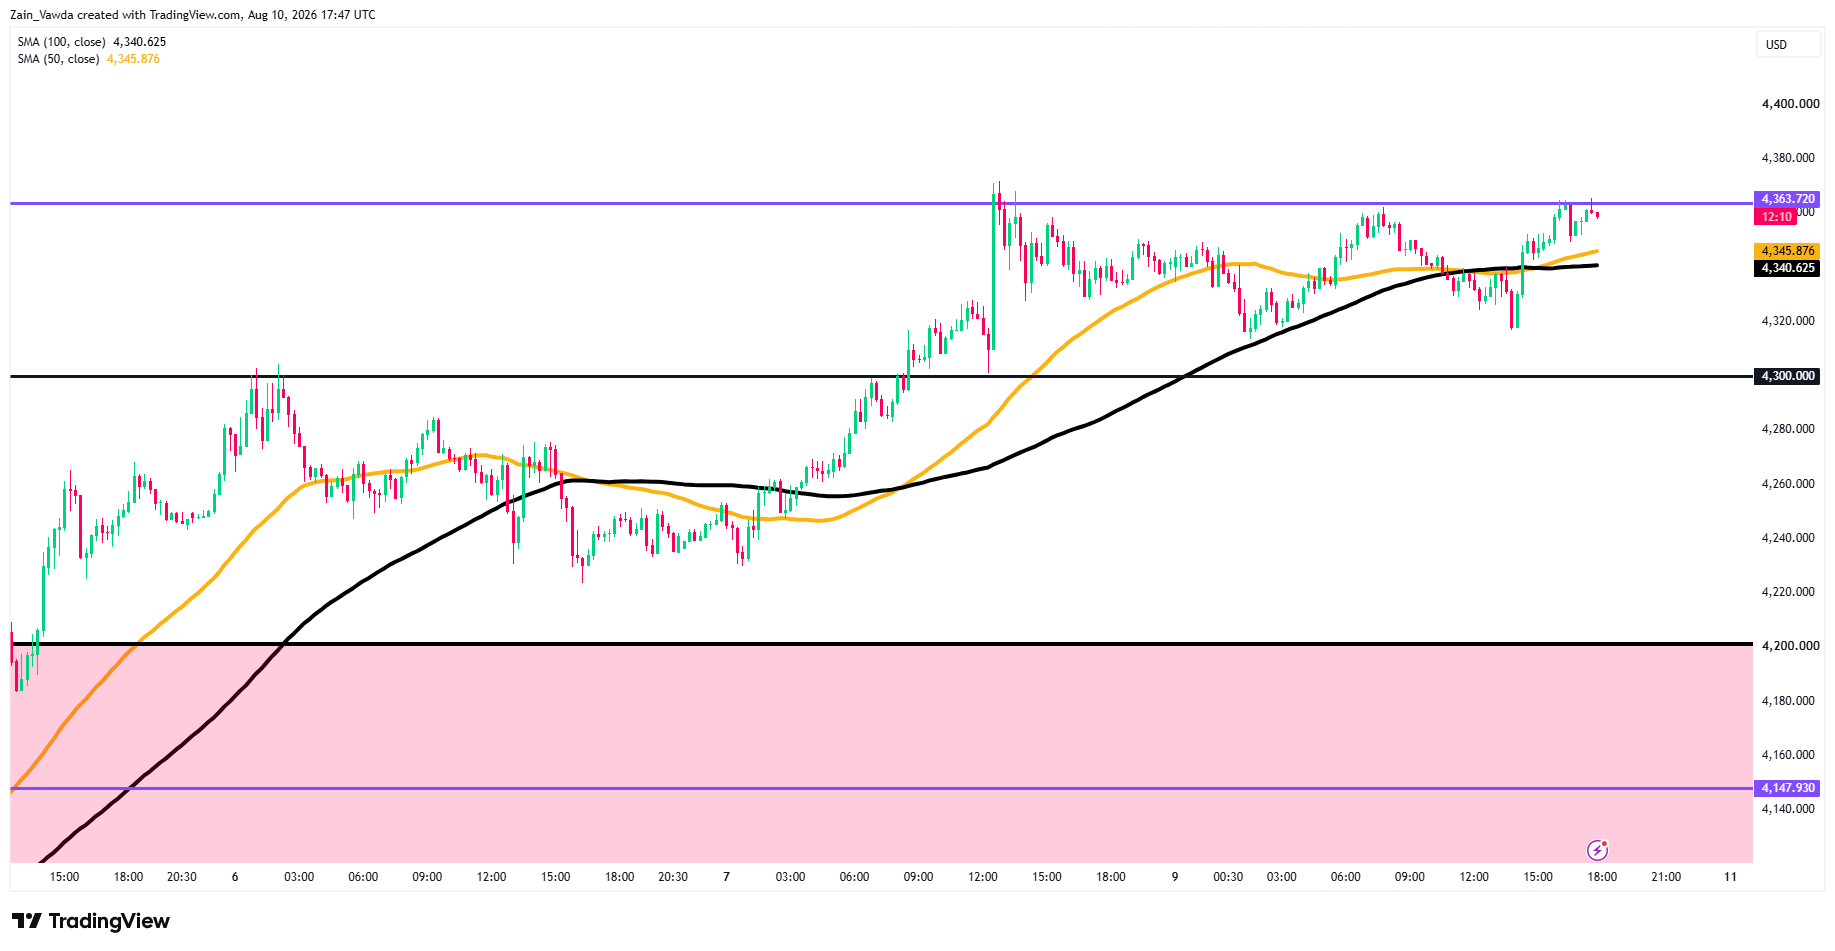
M15 — Gold is pressing 4,363.72 again after riding the rising 50-SMA (4,345.88) and 100-SMA (4,340.63) higher into the close — both stacked and sloping up beneath price, a constructive short-term structure.
A clean M15 close above 4,363.72 opens fresh highs; rejection keeps it capped, with 4,340/4,300 the support ladder below. Momentum favours bulls, but this is the third tap of resistance into Wednesday's CPI.
How Wednesday’s CPI May Break It
Potential Scenarios

Source: Created by Zain Vawda
Retail Trader Sentiment
Based on the most recent data from the Positioning Edge Tool on MarketFramework, shows an extreme bullish divergence where profitable traders hold a 12% higher net long bias.
Traders use this data to track "smart money" sentiment versus the retail crowd. An extreme divergence highlights when successful participants are heavily positioned in one direction compared to struggling traders, helping users spot high-probability trend continuation or reversal setups.
This gives you a clear view of market sentiment that goes beyond simple price charts. Don't trade in the dark; visit the Positioning Edge Tool to explore how this unique edge can enhance your trading strategy.


