
Under normal market conditions, today would have been a gold day. The UAE’s emergency authority posted a fresh air-defence alert as the country came under aerial attack, oil is holding above $80 a barrel, and the Iran standoff is escalating rather than cooling.
Yet gold is lower, trading near $4,350, down about 1.3% on the day and snapping a two-day winning streak.
Is oil going to keep gold buyers on the defensive?
It Went to the Dollar, Not Gold
That is the whole story of today’s tape. The greenback bounced off a two-month low, and its not bullion, is soaking up the fear bid. The reason is a chain that has defined this whole conflict: the same escalation that scares markets also pushes oil higher, higher oil feeds inflation, and more inflation revives bets that the Fed’s next move is a hike, not a cut.
That lifts US Treasury yields and the dollar together. Gold pays no interest, so when yields and the dollar climb, it gets sold, even on a day the headlines look tailor-made for it.
Two of Gold’s Three Drivers Turned Against It
Gold really answers to three things: real yields, the dollar, and fear. Today the first two went the wrong way.
The 30-year Treasury yield hit its highest level since 2007, and the dollar built on its overnight bounce as traders priced the oil-inflation risk. That left only the fear leg working in gold’s favour, and even that leaked into the dollar, which is itself a safe haven.
When the fear trade and the rate trade point at the same winner, and that winner is the dollar, gold is left carrying the geopolitics with none of the reward. It has now been rejected at the $4,450 area twice.
What are the Charts Saying
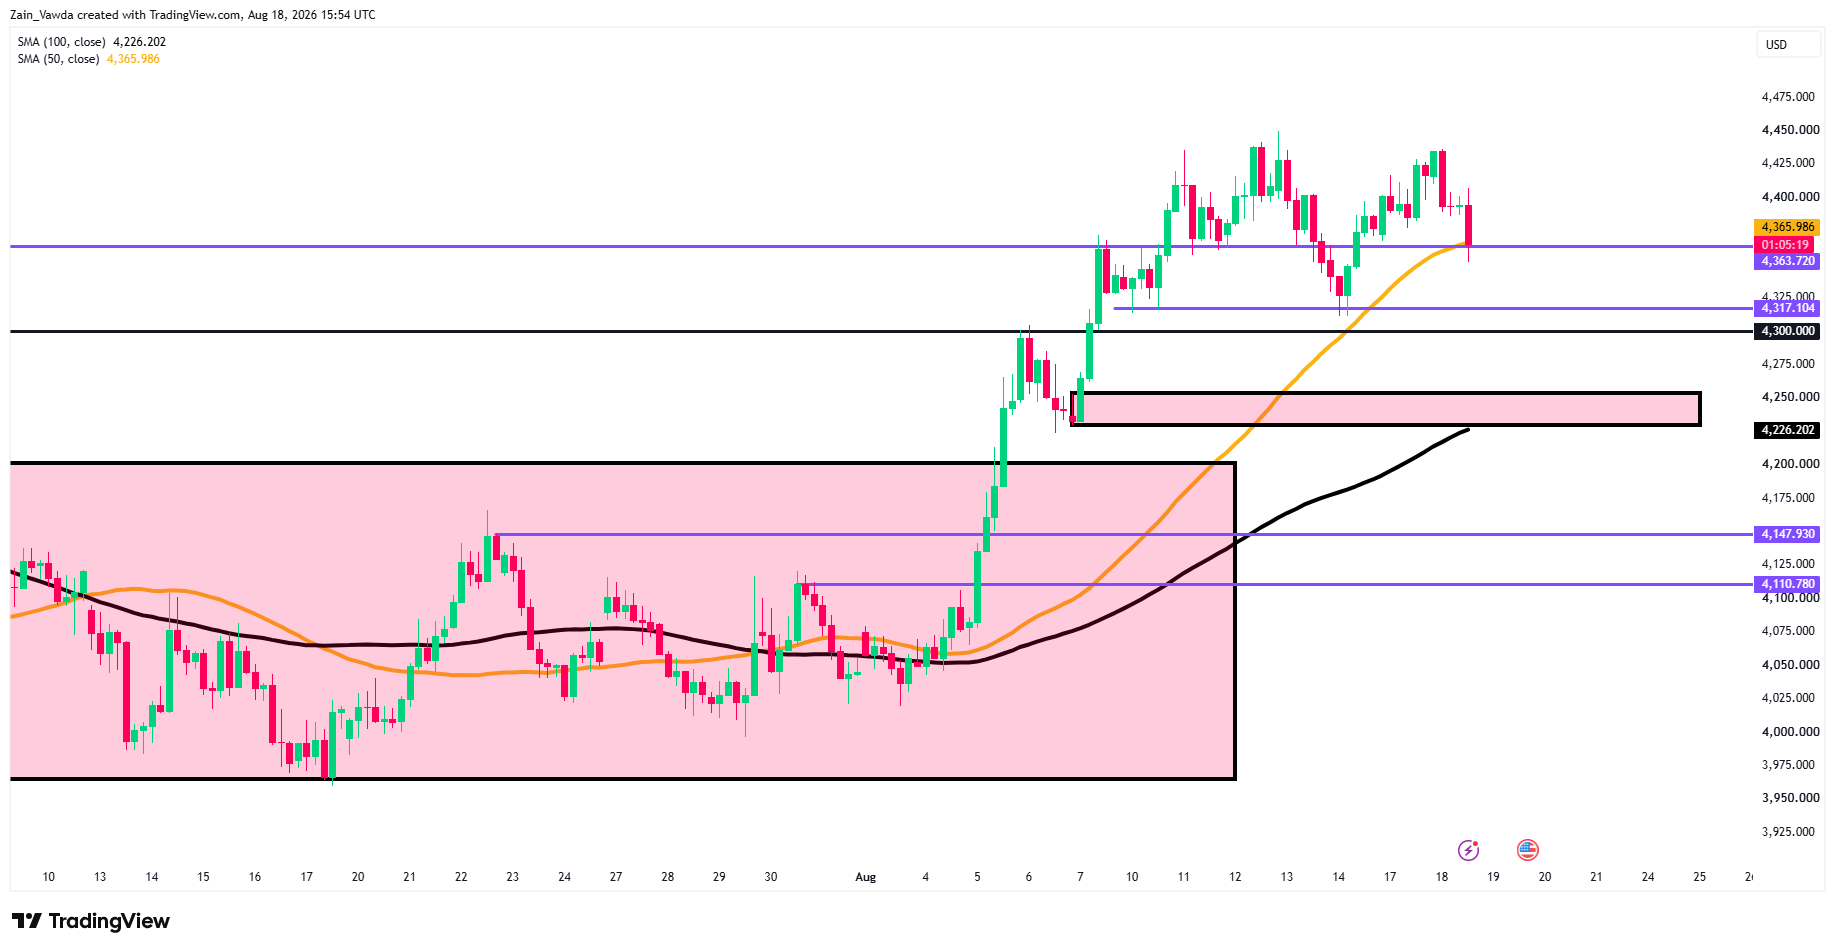
Gold (XAU/USD) Four-Hour Chart, August 18, 2026
Source: TradingView
Gold (XAUUSD) is pulling back from recent highs near 4,450, currently testing critical dynamic support at the 50 SMA (4,365.98) and the horizontal key level at 4,363.70.
Key Technical Levels:
- Resistance: 4,425.00 – 4,450.00 (recent swing highs).
- Immediate Support: 4,363.70 – 4,365.98 (50 SMA confluence).
- Downside Targets: 4,317.10 and 4,300.00.
- Major Demand Zone: 4,226.20 (100 SMA) – 4,250.00 region.
Maintaining price action above 4,363 keeps short-term bullish momentum intact for a retest toward 4,425. A sustained close below 4,363 opens the door for a deeper correction toward 4,317 and the 4,250 support block.
The Outlook: Which Force Wins?
Near term, the cap is the rate-and-dollar channel, and it only lifts on one of two things. Either Wednesday’s Fed minutes (and Federal Reserve Chair Warsh at Jackson Hole next week) signal the Fed will look through oil-driven inflation, which would ease yields and the dollar and finally let gold’s own war bid express itself or the escalation turns severe enough to trigger a genuine flight to safety that overpowers the rate story.
Absent either, gold likely grinds sideways-to-lower while the dollar keeps winning the fear trade. Here is how the nearest catalyst, Wednesday’s minutes, maps out.
Potential Scenario Matrix
| Scenario | Fed Minutes Read | Gold Path |
|---|---|---|
| Bull | Dovish, dissents look isolated, Fed willing to look through oil-driven inflation | Yields and the dollar ease, the cap lifts, and the live war bid finally reaches gold, reclaim 4,400, retest 4,430–4,450 |
| Base | A split committee, as the 9–3 vote already told us, nothing new | Fear bid and rate cap cancel out; gold chops between the 4,363–4,366 pivot and 4,400–4,450 |
| Bear | Hawkish, the three hike-seekers were close, oil keeps the tail armed | Dollar keeps winning the fear trade; lose 4,363 → 4,317 → 4,300 → the 4,226–4,250 demand zone |
Trader Positioning Data
The latest data from the Marketframework Positining Edge Tool displays an extreme bearish divergence. Unprofitable traders are heavily long at 73%, whereas profitable traders maintain a balanced 50% long position (23% more short).
This split indicates smart money may be leaning bearish while retail remains heavily caught on the long side.


