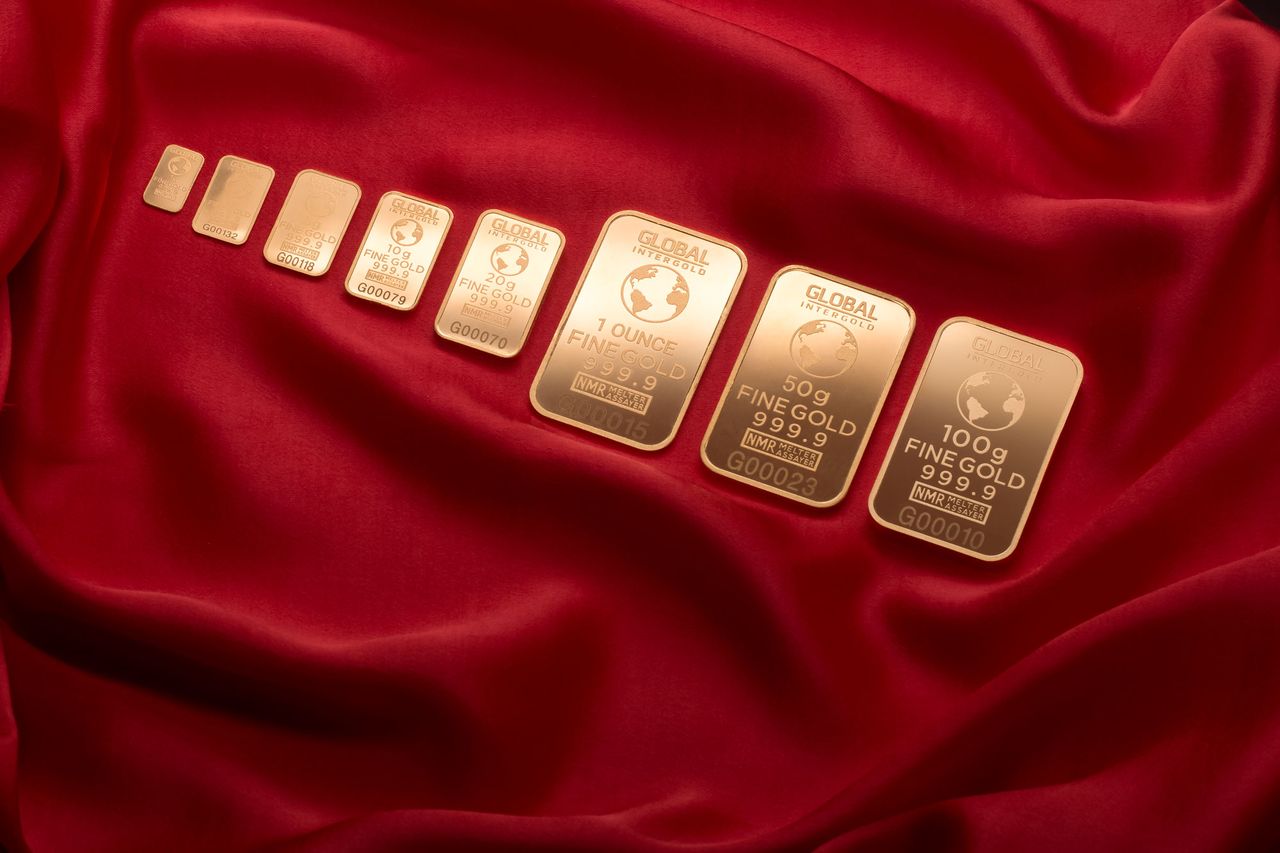
Gold futures are hovering around $4,665.60, leaving the metal at an important short-term technical pivot as traders await Federal Reserve ChairKevin Warsh's appearance at Jackson Hole.
Gold's YTD Journey
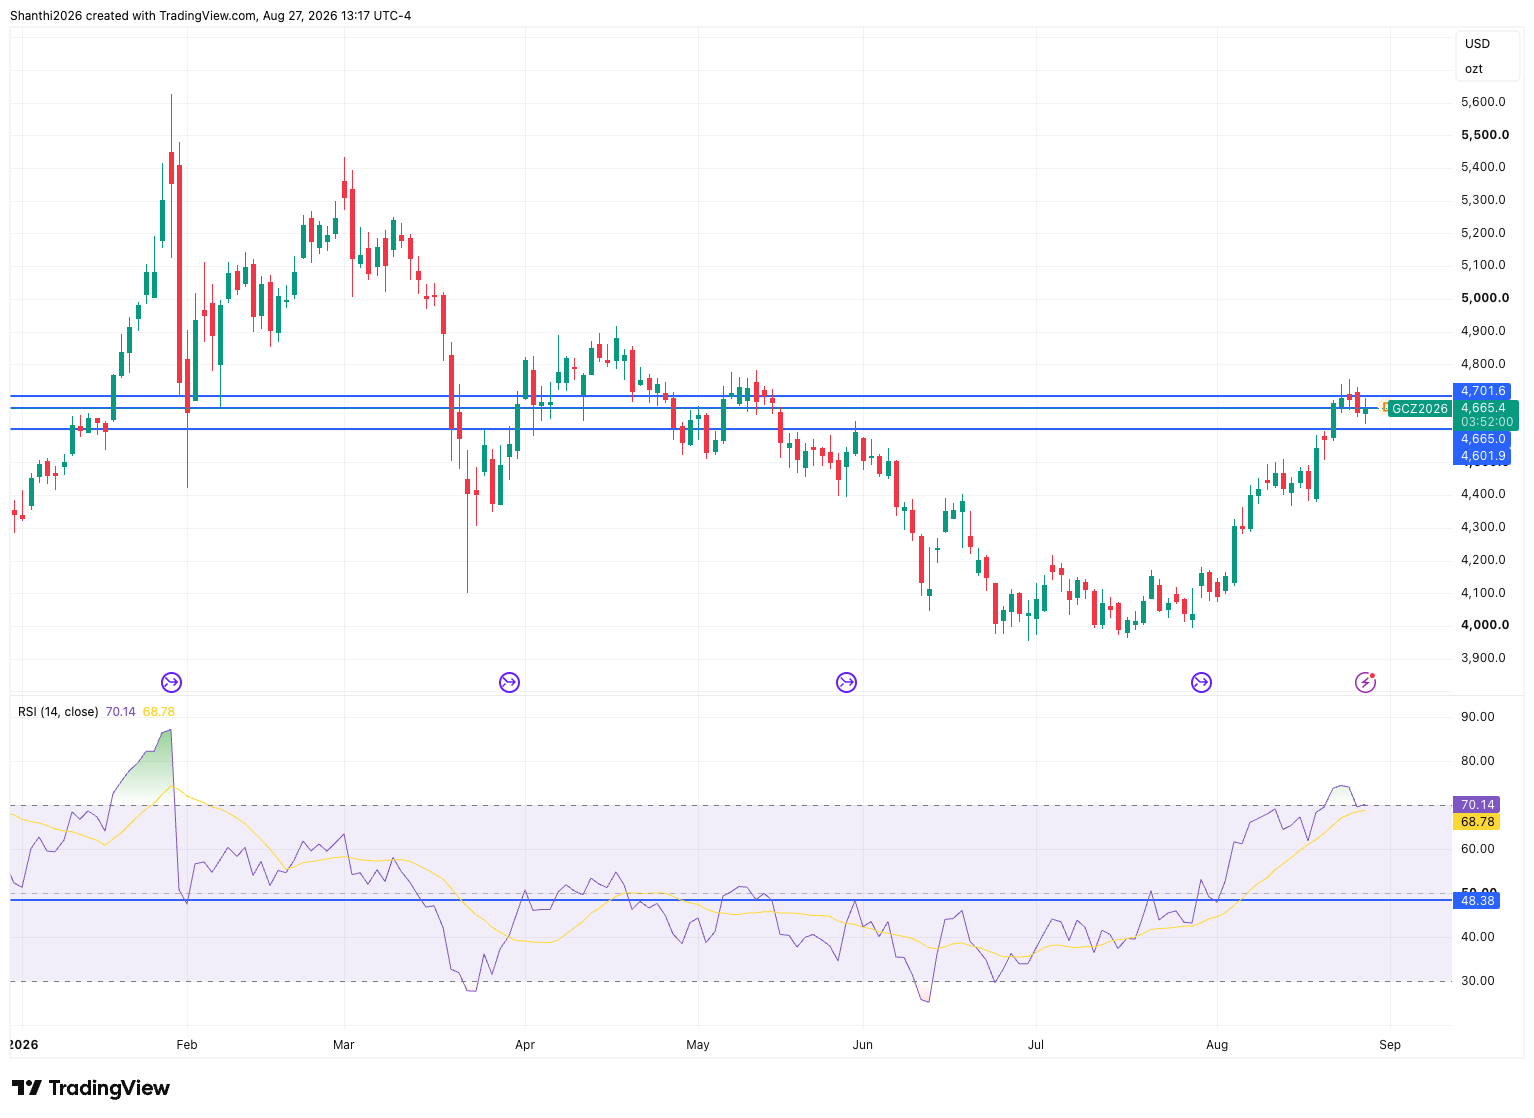
The yellow metal’s move to around $4,665 represents a solid gain for the year, but the path has been anything but linear. The metal surged to a record high above $5,586.20 in January, subsequently underwent a prolonged correction toward the $4,000 area, and has since staged a powerful recovery. Gold futures are now roughly 6% above their year-to-date starting level, underscoring that the latest rally is a recovery within a highly volatile year rather than a straight-line advance.
That broader perspective makes the current $4,640–$4,700 zone particularly important. Gold has recovered substantially from its midyear lows, but remains well below its January record.
The next directional move could depend on whether buyers can defend the current support zone and, more importantly, whether Warsh delivers a policy message capable of shifting Treasury yields and the U.S. dollar.
That leaves gold at a critical intersection: $4,665 is the battleground, $4,700 is the breakout level, and Warsh could provide the catalyst that determines which level breaks first.
$4,665 Becomes the Near-Term Battleground
At $4,665.60, gold is sitting near a short-term pivot rather than a major historical support or resistance level. The broader technical question is whether the metal can stabilize around the $4,640-$4,665 zone after failing to sustain its move toward $4,700.
Holding this area would suggest that the recent decline is more likely a consolidation phase than a reversal of the broader advance. A move back above $4,670 would strengthen that interpretation and put $4,700 back within immediate reach.
But a sustained break below $4,640 would change the picture. It would indicate that sellers are gaining control of the short-term trend and could expose gold to a test of $4,600.
$4,700 Is the Real Technical Test
While $4,665 is the immediate pivot, $4,700 is the level bulls ultimately need to reclaim.
The area around $4,700 has acted as a ceiling following gold's recent advance. A decisive move above it would provide stronger evidence that buyers have absorbed the latest profit-taking and are prepared to resume the uptrend.
A sustained breakout could put $4,750–$4,770 on the radar as the next upside zone.
The opposite scenario would be a rejection near $4,700 followed by a break below $4,640. That would increase the probability of a deeper correction toward $4,600, while a more aggressive sell-off could eventually bring the $4,500 area back into focus.
Warsh Puts the Technical Setup to the Test
This is where Warsh's Jackson Hole appearance becomes important.
Gold's immediate direction can be heavily influenced by Treasury yields and the dollar because higher yields increase the opportunity cost of holding a non-yielding asset such as gold. A weaker dollar, meanwhile, generally makes dollar-denominated gold more attractive to international buyers.
Therefore, the market's interpretation of Warsh could determine whether $4,665 becomes a launching pad for another rally or the starting point for a deeper pullback.
Scenario 1: Dovish Warsh Could Clear the Path to $4,700
A dovish Warsh would be one who
- signals greater openness to lowering interest rates
- expresses increased concern about weakening economic or labor-market conditions, or
- suggests that inflation risks are becoming less threatening.
The important transmission mechanism would be expectations. If traders conclude that the Fed is becoming more comfortable with a pause, Treasury yields could decline and the dollar could weaken.
That would create a favorable macro backdrop for gold.
Bullish sequence:
$4,665 holds → $4,670 reclaimed → $4,700 breaks → $4,750–$4,770
Scenario 2: Balanced Warsh Keeps Gold Range-Bound
Warsh could also deliver a neutral or balanced message, acknowledging progress on inflation while stressing that the Fed must remain data-dependent.
Such a message would give traders little reason to dramatically alter interest-rate expectations.
In that case, Treasury yields and the dollar could see relatively limited directional movement, leaving gold to trade primarily on technical factors.
The result could be continued consolidation between $4,640 and $4,700, with $4,665 acting as the center of the range.
For traders, the important signal would be a break outside that range. Until then, chasing either direction could prove difficult.
Neutral sequence:
$4,640 support → $4,665 pivot → $4,700 resistance
Scenario 3: Hawkish Warsh Could Send Gold Toward $4,600
A hawkish Warsh would emphasize persistent inflation risks, caution against cutting rates too soon, or indicate that restrictive monetary policy may need to remain in place for longer.
That could lead traders to push back expectations for rate cuts, potentially lifting Treasury yields and strengthening the dollar.
For gold, that combination would be a headwind.
The first technical warning would come if gold loses $4,640 decisively. Once that support gives way, $4,600 becomes the next obvious downside target.
A break below $4,600 would weaken the short-term structure further and could eventually expose the $4,500 area.
Bearish sequence:
$4,665 fails → $4,640 breaks → $4,600 → $4,500
RSI Signals Strong Momentum, but Nears Overbought Territory
The 14-day RSI is at 70.14, up sharply from the sub-50 readings seen during gold's July consolidation. That puts momentum firmly in bullish territory, although the indicator has now moved just above the traditional 70 overbought threshold.
Importantly, an RSI above 70 does not by itself signal an imminent reversal. Instead, it shows that buying momentum has become stretched. The RSI's average/signal line is around 68.78, meaning momentum remains strong but is beginning to approach a zone where traders could become more cautious.
For gold, the RSI creates an important distinction between the scenarios. If RSI remains above 70 while gold breaks $4,700, it would confirm strong upside momentum, potentially supporting a move toward $4,750–$4,770. But if gold fails at $4,700 and RSI rolls back below 70, that would indicate momentum is cooling and could reinforce a pullback toward $4,640 and $4,600.
Source: TradingView
Watch Yields and the Dollar for Confirmation
Gold traders should therefore watch more than the headline reaction to Warsh.
A move above $4,700 accompanied by falling Treasury yields and a weaker dollar would provide stronger confirmation that the breakout is fundamentally supported.
Conversely, if gold initially jumps but yields and the dollar rise following Warsh's comments, the move could prove difficult to sustain.
The same applies on the downside. A break below $4,640 accompanied by rising yields and a stronger dollar would reinforce the bearish technical signal.
The key question is no longer simply whether Warsh is dovish or hawkish. It is whether his policy message is strong enough to push gold through one of these technical boundaries.
For bulls, the ideal outcome is straightforward: Warsh leans dovish, yields and the dollar fall, $4,665 holds, and gold breaks $4,700. For bears, the opposite setup, namely a hawkish Warsh, higher yields, stronger dollar and a break below $4,640, would put $4,600 back in play.
Data from the MarketFramework Positioning Tool showed profitable Micro Gold Contract (MGC) traders were only 25% long, versus 54.5% long among unprofitable traders, a divergence that MarketFramework classified as "Extreme Bearish." The positioning suggests more successful traders were leaning significantly more bearish than their losing counterparts.


