Gold opened the week prioritizing the rate narrative once more after a weekend of upheaval in the Middle East.
Despite a fourth wave of U.S. strikes on Iran, retaliatory attacks on U.S.-linked sites in Bahrain, Kuwait and Jordan, and Tehran declaring the Strait of Hormuz closed “until further notice,” Gold futures fell, trading near $4,064, down roughly 1.4% on the day and more than 5% over the past month.
Silver is faring worse, with SI futures off 1.7% near $59.10.
The reflex trade war means gold up remains broken because the transmission channel runs through crude. Oil surged more than 4% toward $75 after last week’s 5.4% advance, with WTI near $74 after a pullback.
Looking at Hormuz, Windward is tracking just six vessels through the strait versus 18–22 daily crossings earlier this month.
In 2026’s macro regime, an oil shock is an inflation shock, and an inflation shock is a rate shock. Every dollar oil adds hardens the case for the Warsh Fed to hike, lifting real yields and the dollar, the two forces gold is most sensitive to.
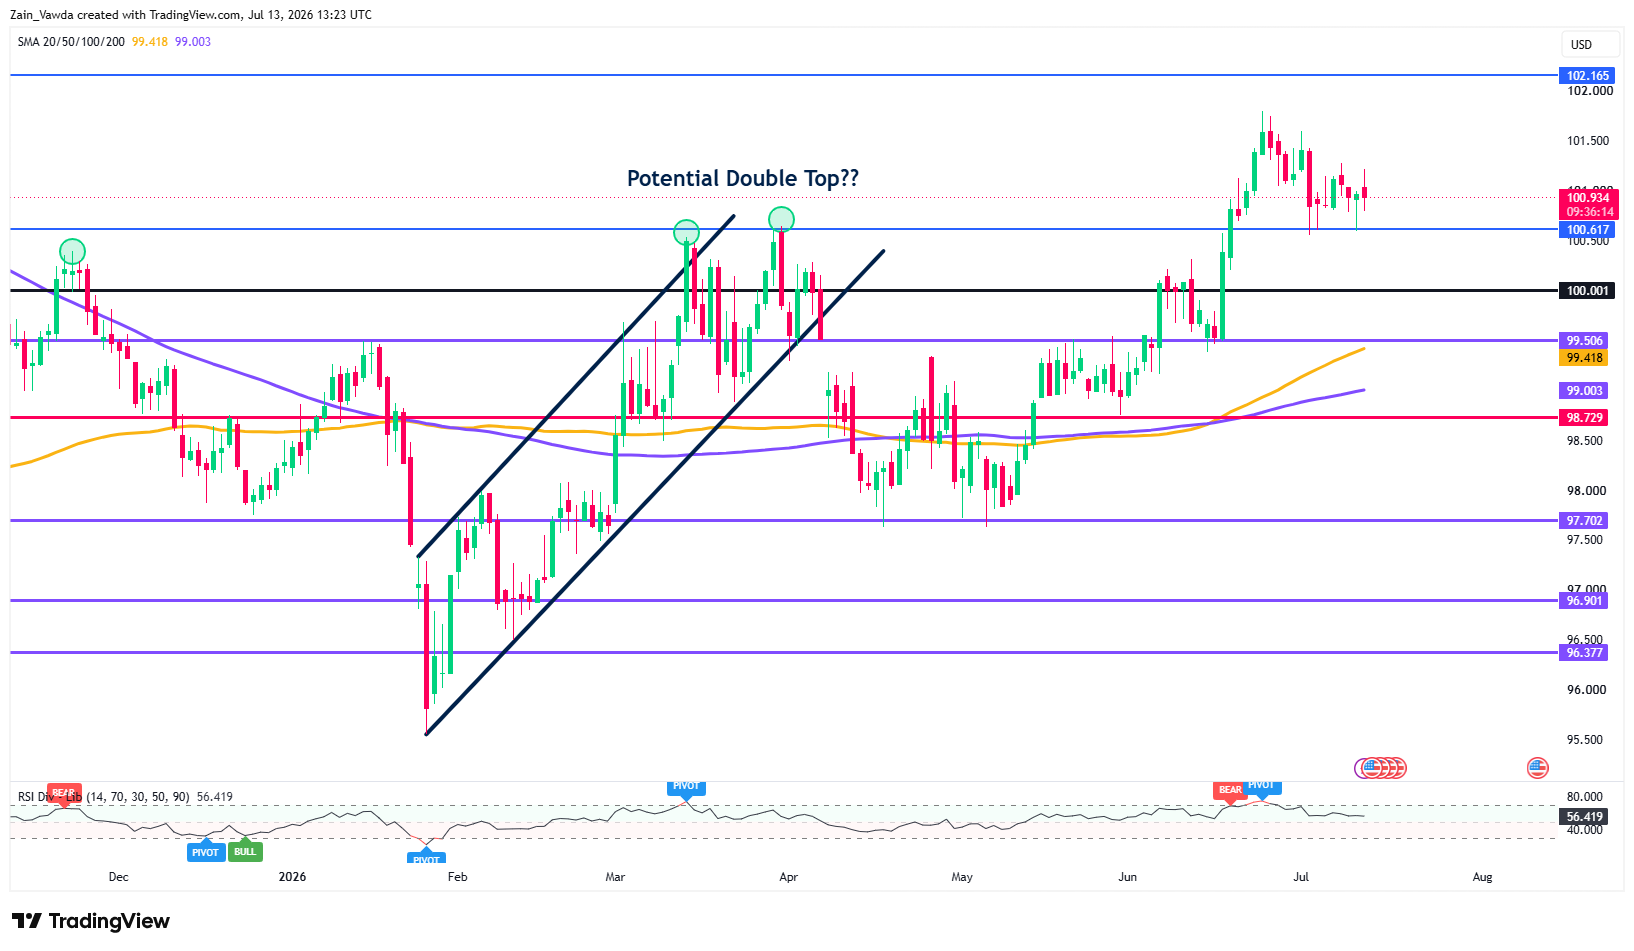
The 10-year sits at 4.47%, the 2-year at 4.22%, and the DXY is holding near 101.
US Dollar Index (DXY) Daily Chart, July 13, 2026
Source: TradingView
Why Hormuz Could Overshadow Tuesday’s US CPI
U.S. inflation data is due Tuesday at 08:30 ET, when June CPI lands, the final inflation print before the July 29 FOMC.
Consensus sees headline easing to 3.8% with core steady at 2.9%, and June’s oil collapse may even produce a negative month-over-month headline reading. In a normal week, that head-fake would dominate the tape.
This is not a normal week. June CPI was collected before the weekend’s escalation, it describes an oil market that no longer exists.
If the strait stays contested and oil keeps climbing toward the $80s, traders will treat a soft print as stale news and price the reacceleration oil guarantees for July and August.
A backward-looking disinflation number cannot compete with a forward-looking supply shock. Federal Reserve Chair Kevin Warsh testifies before Congress just hours after the release, and any acknowledgment that renewed energy pressure keeps hikes on the table would bury the CPI reaction entirely.
For gold, the bar for a sustained rally is high: only genuine de-escalation, which softens both oil and rate expectations, restores the metal’s footing.
Potential Scenario Matrix — Catalyst: June CPI, Tuesday July 14
| Case | Trigger | Gold Reaction |
|---|---|---|
| Bull | De-escalation signals + soft CPI (headline <3.8%); oil retreats, hike odds fade | Reclaim $4,156 channel top; door opens toward $4,250 |
| Base | Strait contested, Brent $75–80; CPI in line, Warsh hawkish but patient | Choppy $4,000–$4,150 range; rallies sold at resistance |
| Bear | Escalation deepens, Brent >$85; CPI overshadowed, July hike pricing builds | Break below $4,000 psychological floor toward the November low near $3,943 |
What are the Charts Saying
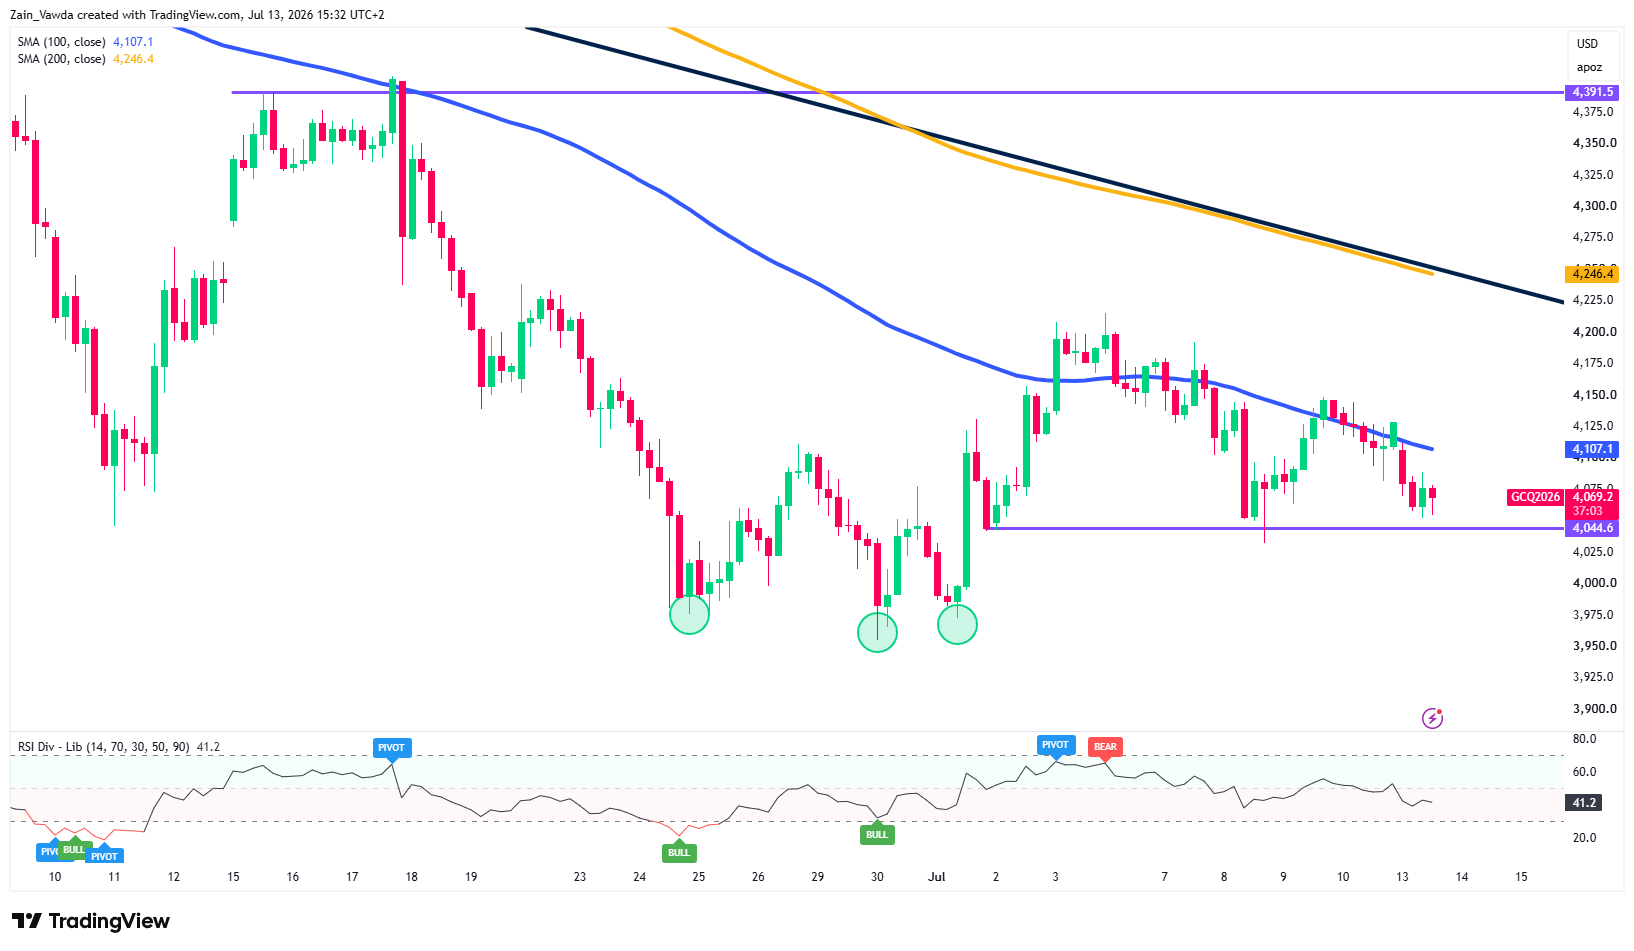
Gold futures remain structurally bearish, trading at $4,069 below both the 100-day SMA ($4,107) and 200-day SMA ($4,246), with a descending trendline from the April highs capping every recovery attempt.
Gold Futures Four-Hour Chart, July 13, 2026
Source: TradingView
The early-July rebound off the triple-bottom zone around $3,950–$3,975 stalled at the 100 SMA, and price has since rolled over into a sequence of lower highs.
Immediate support sits at $4,044.6, a break opens the door back toward the $4,000 psychological level and the June lows, where prior bullish RSI divergences formed.
RSI at 41.2 shows fading momentum without being oversold, leaving room for further downside.
Bulls need a reclaim of $4,107 to neutralize the bias; resistance beyond that stacks at the trendline near $4,225 and $4,246.
Trade Validator Insight/Retail Positioning
Trade Validator data has shown a recurring split in GC during geopolitical spikes: unprofitable cohorts tend to buy war headlines reflexively, while profitable traders wait for the rates market to confirm direction before committing.
With gold falling on escalation, the tape is siding with the disciplined cohort: the rate channel, not the fear channel, is in control.
Keep an eye on the Validator before Tuesday’s print for more insights.


