
Gold (XAU/USD) experienced a noticeable pullback, dropping 1% after the release of in-line U.S. inflation data. The decline comes as market participants digest a batch of stronger broader U.S. economic figures. With inflation arriving precisely as expected, the lack of a downside surprise prompted a reaction in the bond market, where U.S. Treasury yields edged higher as markets continue to weigh the inflation and Federal Reserve outlook.
This uptick in yields has exerted near-term downward pressure on non-yielding assets like precious metals. As markets adjust their Fed policy expectations following the data, gold is seeing a natural cooling-off phase following its recent aggressive climb.
Gold (XAU/USD): Technical Outlook
Gold (XAU/USD) is pulling back after a strong run higher, and the three timeframes tell a consistent story: bullish underneath, but losing momentum in the short term.
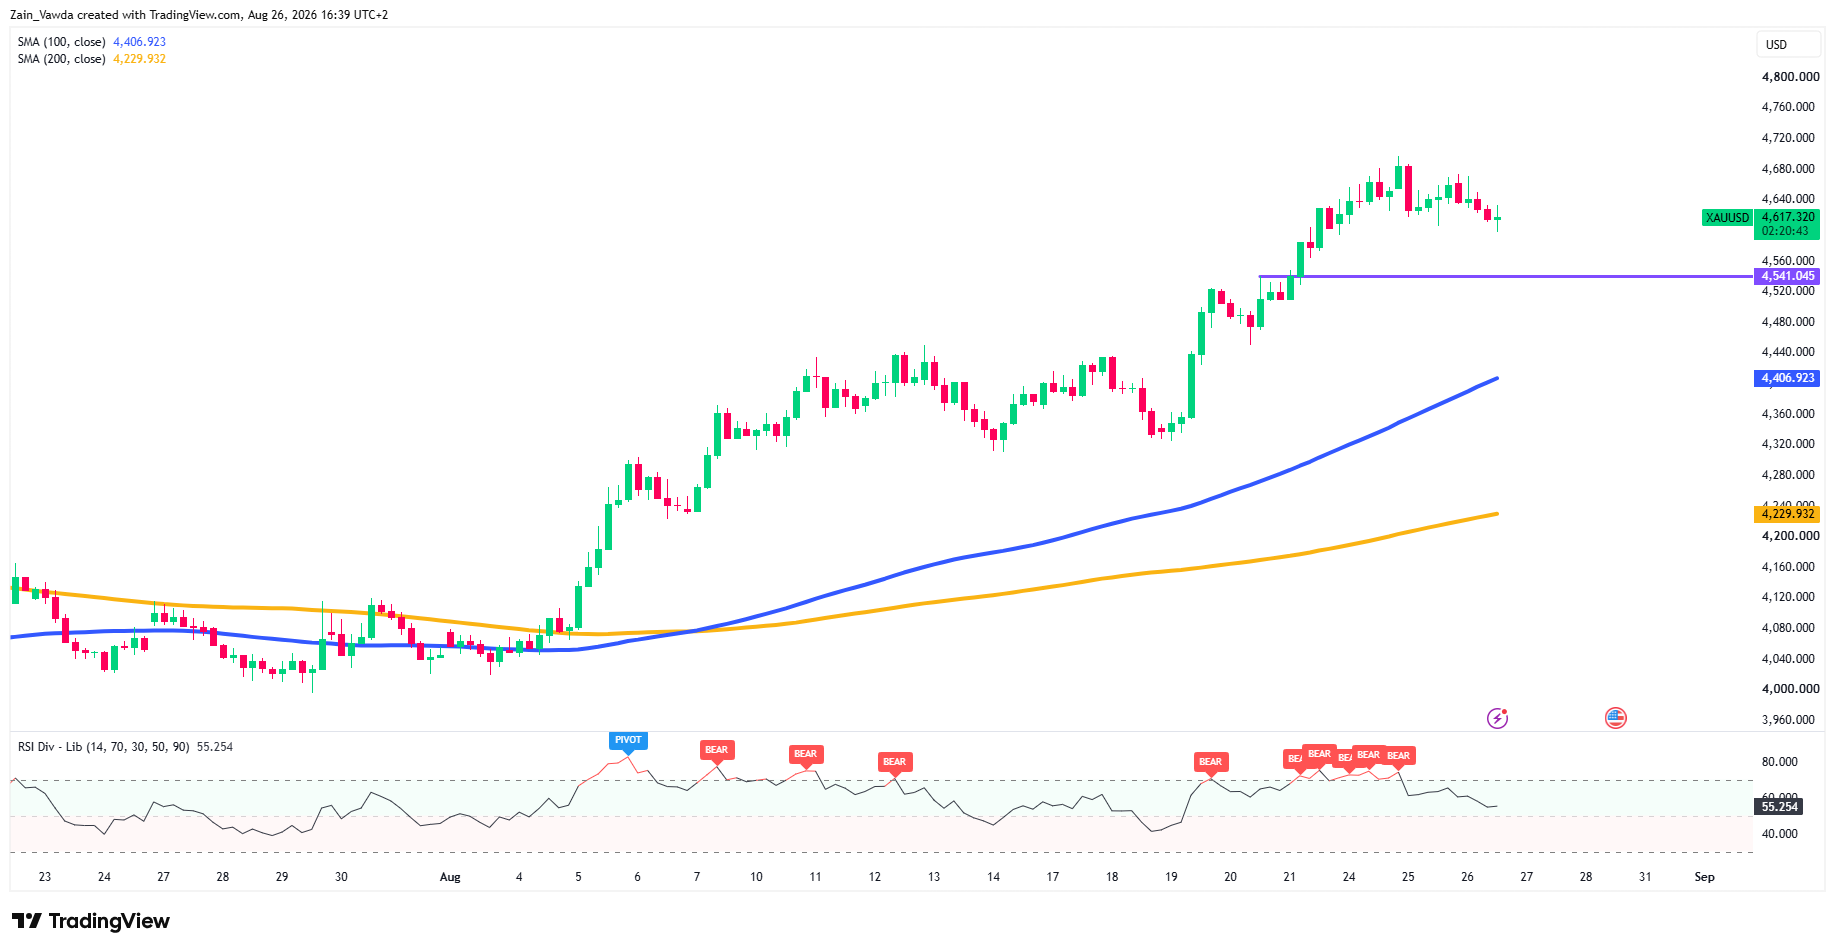
Four-hour (the big picture): The trend is firmly up. Price climbed from around $4,040 in early August to a peak near $4,700 before easing back to roughly $4,617. It sits well above both the 100-period moving average ($4,407) and the 200-period average ($4,230) — textbook bullish. The RSI momentum gauge is at 55 but has flagged repeated bearish divergences near the highs, a warning that buyers are tiring. Former resistance at $4,541 is now the key support line.
Gold (XAU/USD) H4 Chart, August 26, 2026
Source: TradingView
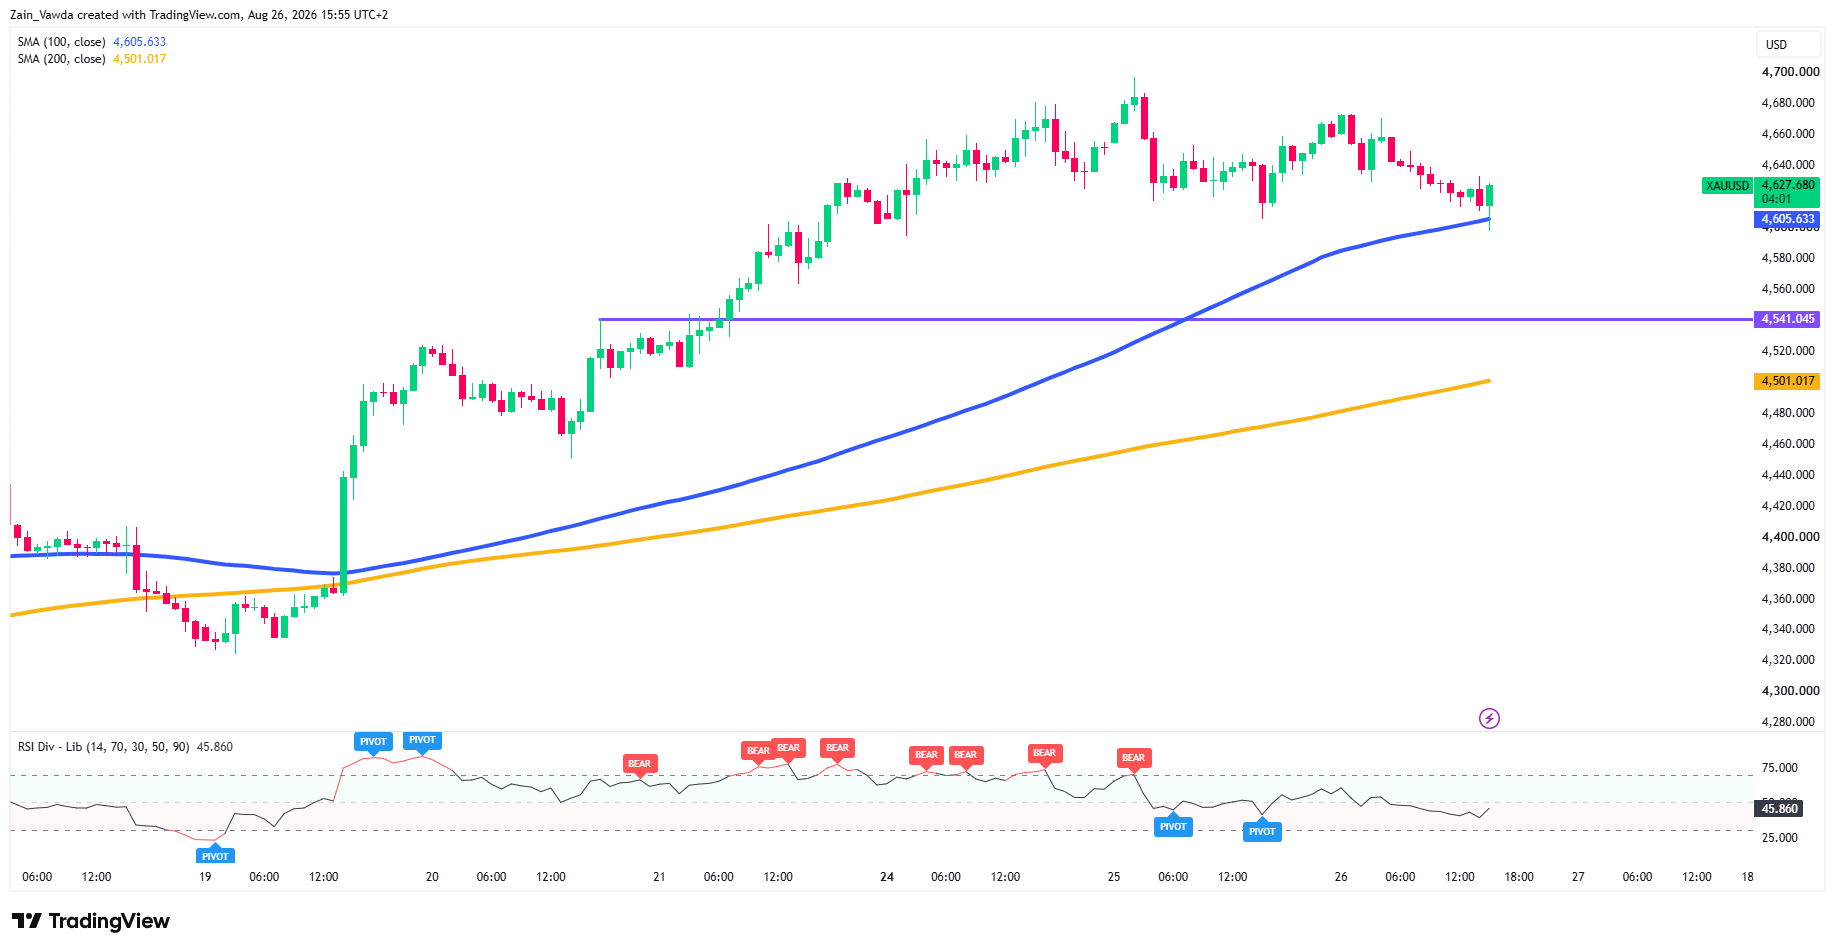
One-hour (the swing view): The uptrend still holds, with price above its 100-period ($4,606) and 200-period ($4,501) averages. But momentum has cooled — RSI has slipped to around 46, below the neutral 50 mark, and a run of bearish divergence signals has stacked up at the recent peaks. That points to a stalling rally rather than a fresh push higher.
Gold (XAU/USD) H1 Chart, August 26, 2026
Source: TradingView
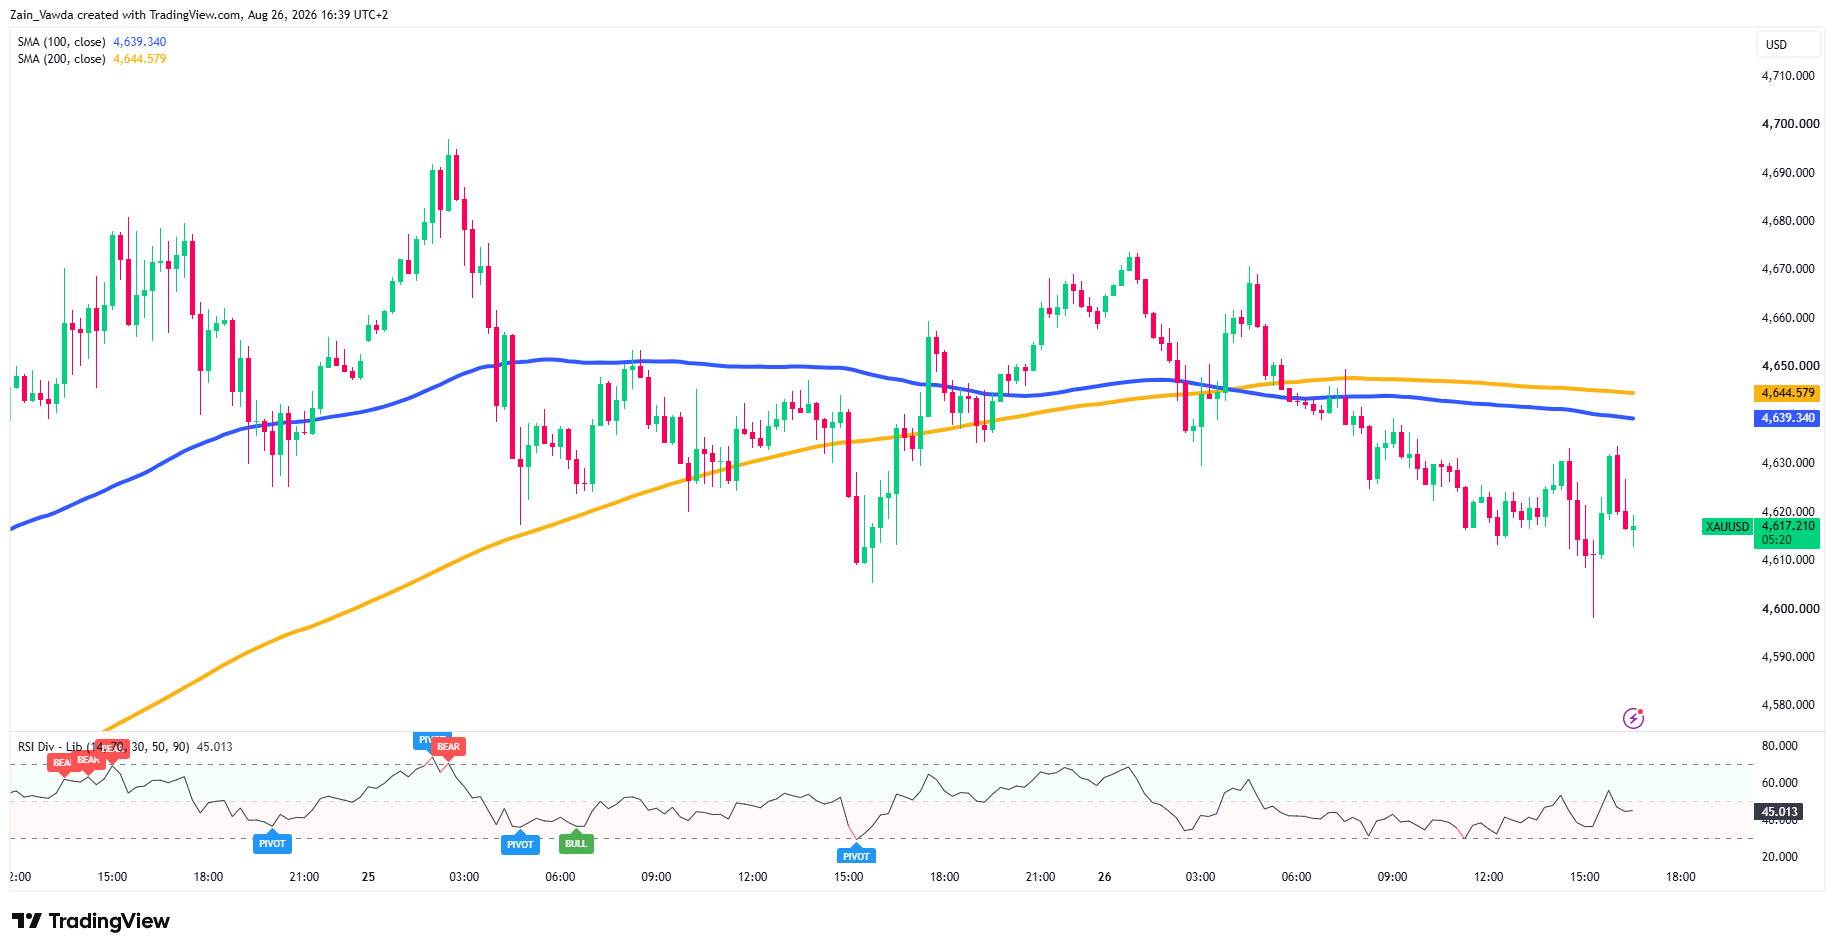
Fifteen-minute (the near term): Here the tone turns defensive. Price ($4,617) is trading below both short-term averages ($4,639 and $4,644), which have flattened and begun to roll over, so sellers hold the intraday edge. RSI near 45 is climbing off an oversold low, hinting at a possible bounce, but the immediate bias stays lower.
Gold (XAU/USD) M15 Chart, August 26, 2026
Source: TradingView
The takeaway: The broader uptrend is intact, but a short-term correction is underway. Watch $4,600 as the first floor and $4,541 as the line that must hold to keep the bull case alive.
On the upside, $4,644 and then $4,660 are the hurdles to clear. Holding above $4,541 favours dip-buyers; a clean break below it would open the door to a deeper pullback.
Trader Positioning Data - The Smart Money Angle
The Positioning Edge data on Micro Gold (MGC) shows profitable traders sitting 8% more long than unprofitable ones, flagged here as a strong bullish divergence.
In plain terms, the traders with a winning track record are leaning into the long side more heavily than the crowd that typically loses. Profitable traders are 58% long versus 50% for the unprofitable group.
This matters because it separates the signal from the noise. Rather than watching overall sentiment which is often a contrarian trap, this tool tracks what the consistently successful cohort is actually doing.
When that group leans one way while the losing crowd hesitates, it can offer an early clue to the next move. For gold traders weighing this pullback, the data suggests the smart money still favours the upside, adding weight to the "buy-the-dip" case above key support.


