
Gold started September on the back foot. Spot prices fell more than 2% on Tuesday morning, dropping to around $4,354 an ounce, the weakest level since early June.
The move extends a sharp slide that began late last week and puts the metal firmly back under pressure just as traders brace for a run of important U.S. jobs data.
Why Gold Is Falling
The main driver is a jump in US Treasury yields. When government bonds pay more, holding gold, which pays no interest at all becomes less appealing, so money flows out.
Yields have risen because investors now expect the Federal Reserve to raise interest rates rather than cut them. That shift followed Fed Chair Kevin Warsh's speech at Jackson Hole on August 28, where he made clear that bringing inflation down is still the central bank's top priority.
Markets now put the odds of a September hike near 66%, up from about 36% before he spoke.
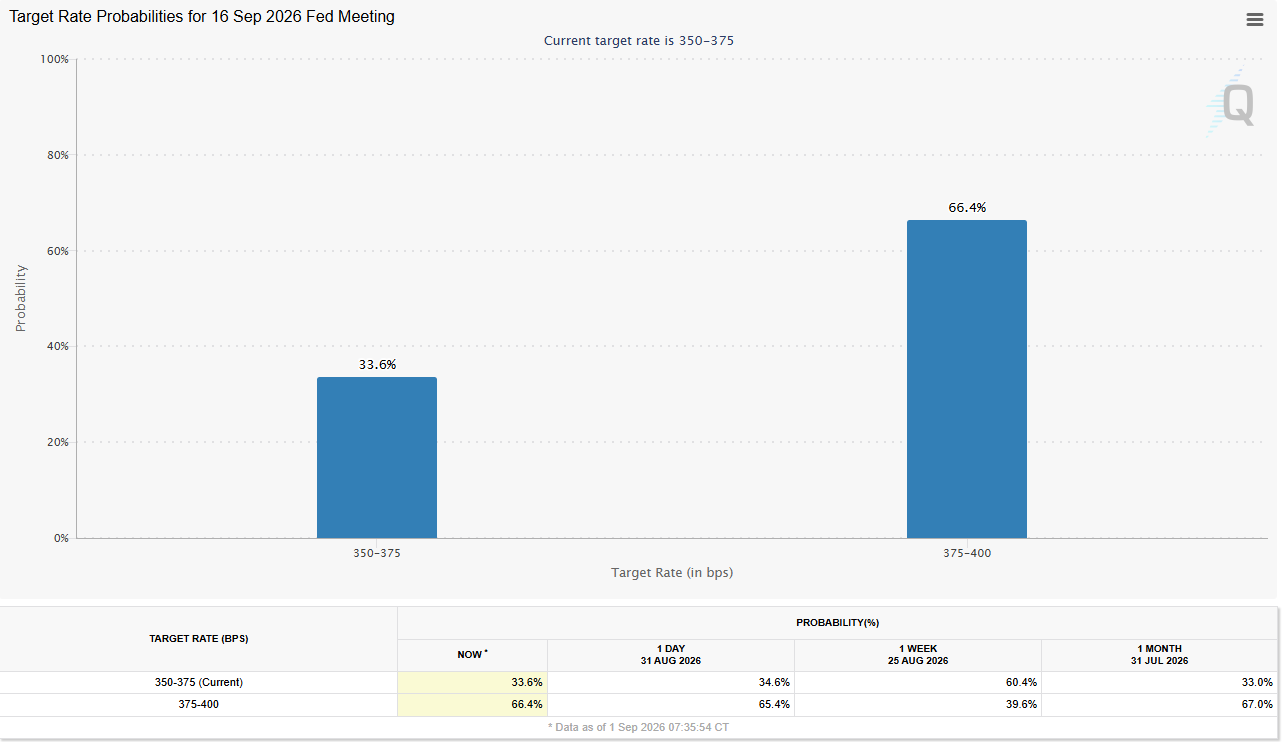
Source: CME FedWatch
What Traders Are Watching Next
Attention now turns to the labour market. The ADP private payrolls report and Friday's official US non-farm payrolls will show how strong hiring really is. A hot number would harden the case for a hike and pressure gold further; a soft one could give buyers a reason to step back in.
Technical Outlook
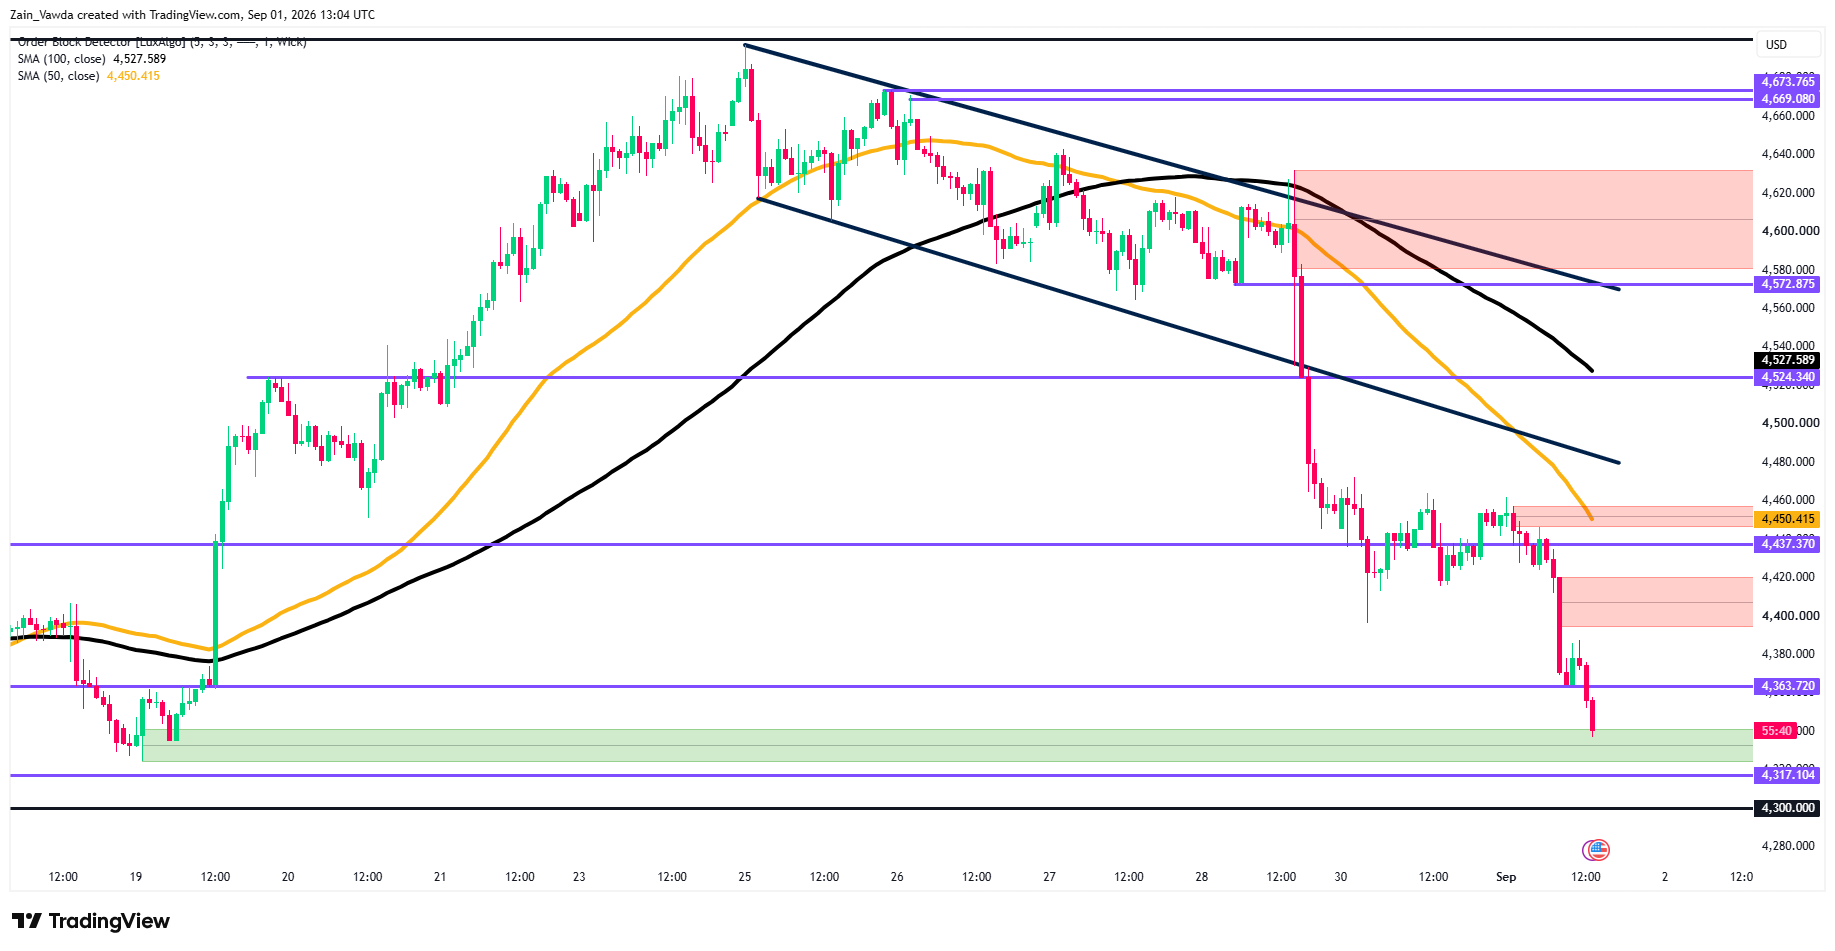
Gold has broken down hard. Price sliced through support at $4,437 and now sits below both the 50-day (~$4,470) and 100-day (~$4,539) moving averages, with the shorter average curling below the longer one — a bearish tell. Momentum is firmly to the downside.
Gold (XAU/USD) One-Hour Chart, September 1, 2026
Source: TradingView
Three ways this could play out into Friday's payrolls:
Bearish: A clean break of $4,363 opens the door to the $4,340–$4,325 demand zone, and below that the $4,317 level. This stays in control while yields keep climbing.
Base case: Price chops between $4,363 support and $4,437 resistance as traders sit on their hands and wait for the jobs data before committing.
Bullish: A soft payrolls print and a reclaim of $4,437 would ease the pressure, opening room back toward the 50-day average near $4,470 and then $4,524.
For the Trader
Positioning Edge data for gold shows an extreme bearish divergence between successful and unsuccessful accounts. Currently, profitable traders are only 47% long, meaning 53% are short, while unprofitable traders remain heavily bullish at 57% long.
While losing traders continue buying, smart money is actively positioning for a price decline. Supported by a 24% rise in trading volume alongside this clear separation in trader sentiment, the overall data indicates strong downward pressure on the asset.


