Gold spent Friday’s European session doing what it has done all week: testing conviction on both sides of the tape.
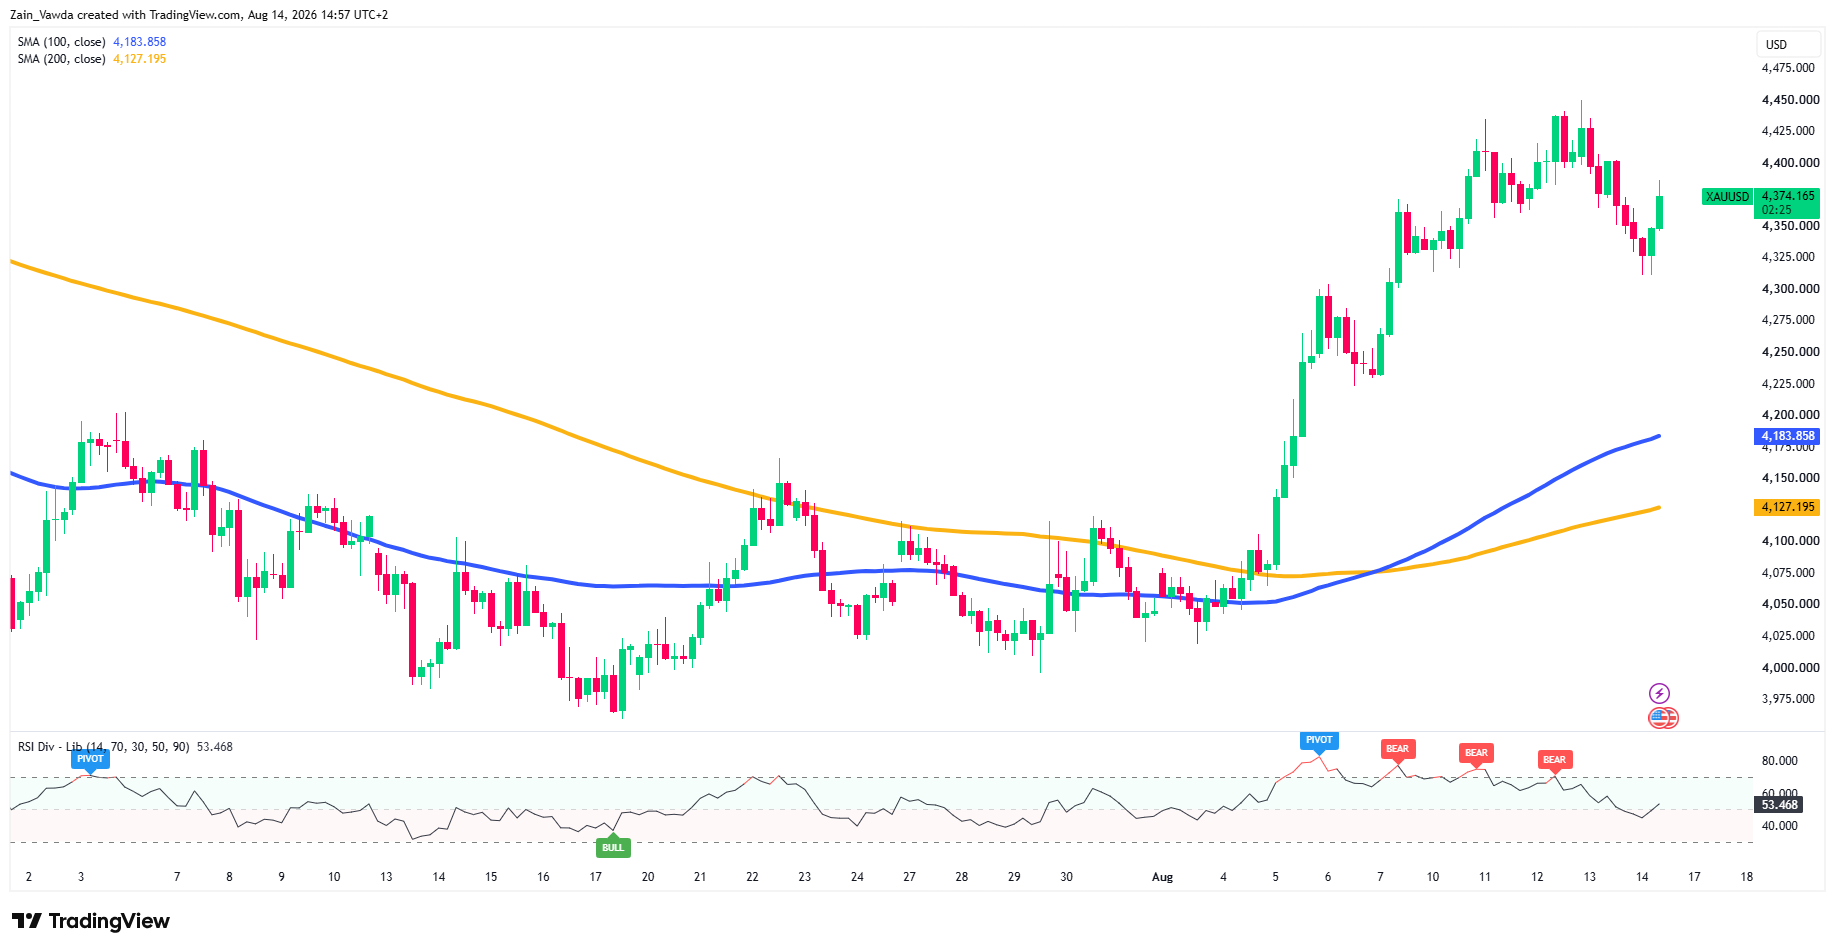
The metal slid into $4,300 for a second straight session on profit-taking off the roughly $4,450 swing high, only for dip-buyers to reclaim the handle and lift spot back toward $4,394 by the London afternoon.
Two days of corrective trade have cooled momentum without breaking structure. Heading into a weekend with the Strait of Hormuz still unresolved, the question for a forward-looking desk isn’t whether gold is bullish, the chart says it is but which catalyst decides the next leg.
The Pullback that Bought Itself Back
Price holds comfortably above both the 100-day MA at $4,183.86 and the 200-day MA at $4,127.20, with the faster average having crossed up through the slower, a golden-cross signal that printed as the June–August coil resolved higher.
RSI has eased to 53.47 from the run of bearish divergences that flagged the $4,450 top, which is the constructive read: momentum resetting inside an uptrend rather than rolling over.
Gold Four-Hour Chart, August 13, 2026
Source: TradingView
The Two-Sided Weekend
The market remains in a tug-of-war pulling gold prices in two opposite directions.
On the positive side, cooling inflation numbers have made a Federal Reserve interest rate hike in September much less likely, while a weaker US dollar has removed a key obstacle that previously held gold back.
However, 30-year US Treasury bond yields recently surged above 5.2%, their highest level since 2001—which weighs heavily on gold because investors tend to prefer higher-yielding bonds over non-yielding precious metals.
As a result, while gold's long-term outlook remains healthy, short-term risks remain high and current bullish chart patterns are not yet a guarantee of a sustained price rally.
Why the Monday gap matters more than Friday’s candle
The biggest risk for investors right now isn't how trading closes on Friday, but what happens over the weekend while markets are closed.
With geopolitical tensions flaring in the Strait of Hormuz after Iran struck two UAE vessels and the U.S. threatened severe sanctions, any weekend news could cause prices to suddenly jump or drop when trading reopens in Asia on Monday.
If the conflict escalates, gold will face two opposing forces: rising panic will push gold prices up as a safe-haven asset, but spiking oil prices will revive inflation fears and the threat of interest rate hikes, which weighs gold down.
Conversely, if tensions cool off, oil prices will drop, inflation fears will fade, rate hikes will be completely ruled out, and gold could freely surge toward record highs.
Ultimately, Monday morning's market opening will set the true direction for gold, making today's University of Michigan sentiment and inflation report the final major catalyst before trading pauses for the weekend.
Scenario Matrix — Keyed to the Weekend / Monday Asian Open
| Scenario | Weekend/Monday Trigger | Gold Path | Cross Asset Tell |
|---|---|---|---|
| Bull | Hormuz de-escalation / deal, or the 30Y rolls over | Reclaim $4,400–$4,450 → trigger $4,470 → $4,530 → ~$4,630 | Oil gaps down, DXY stays sub-100, hike fully out |
| Base | No decisive weekend headline | Chops $4,300–$4,450; dips into $4,300 defended; momentum rebuilds into Jackson Hole (Aug 28) | 30Y hovers ~5.2%, DXY coils under 100 |
| Bear | Real-yield squeeze (30Y > 5.2%) and/or a hawkish surprise | Lose $4,300 → $4,200 → $4,140–$4,160; deeper → $3,930 | 30Y breaks higher, DXY reclaims 100.00 |
In short, gold’s trend remains intact, but Monday’s gap, Hormuz headlines, yields and the dollar will decide whether buyers retest records or defend support first.


