
The Selloff Found Its Floor, Right Where We Flagged It
On Tuesday we asked how far gold’s selloff could run. We now have an answer, at least for today. The bearish path we mapped out played out almost to the level: gold broke below $4,363 and slid straight into the $4,317–$4,300 demand zone and that is exactly where buyers finally stepped in. Price touched its lowest level since early August near $4,282, then snapped back above $4,390.
Why Gold Bounced Today
The rate-hike trade that crushed gold on Tuesday took a breather. On Wednesday the U.S. dollar and Treasury yields pulled back from their recent highs, and because gold pays no interest, even a small dip in yields makes it more appealing to hold. Spot gold rose about 1.4% to around $4,399 as that pressure eased.
A softer-than-expected ADP private-payrolls report (an early read on hiring) helped too, by trimming the odds of a September Fed hike. But notice what gold did not do: it did not race higher on the ADP number.
Traders are saving their real reaction for the bigger report on Friday.
What Traders Are Watching Next
Everything still points to Friday’s official U.S. non-farm payrolls (NFP). ADP is a rough guide; NFP is the number the market trusts.
A weak jobs print would cool the hike talk further and give gold room to keep recovering. A hot print would revive the rate-hike trade, push yields and the dollar back up, and put gold’s fragile bounce at risk.
Until then, expect choppy, headline-driven trade.
The technical picture: a bounce into resistance
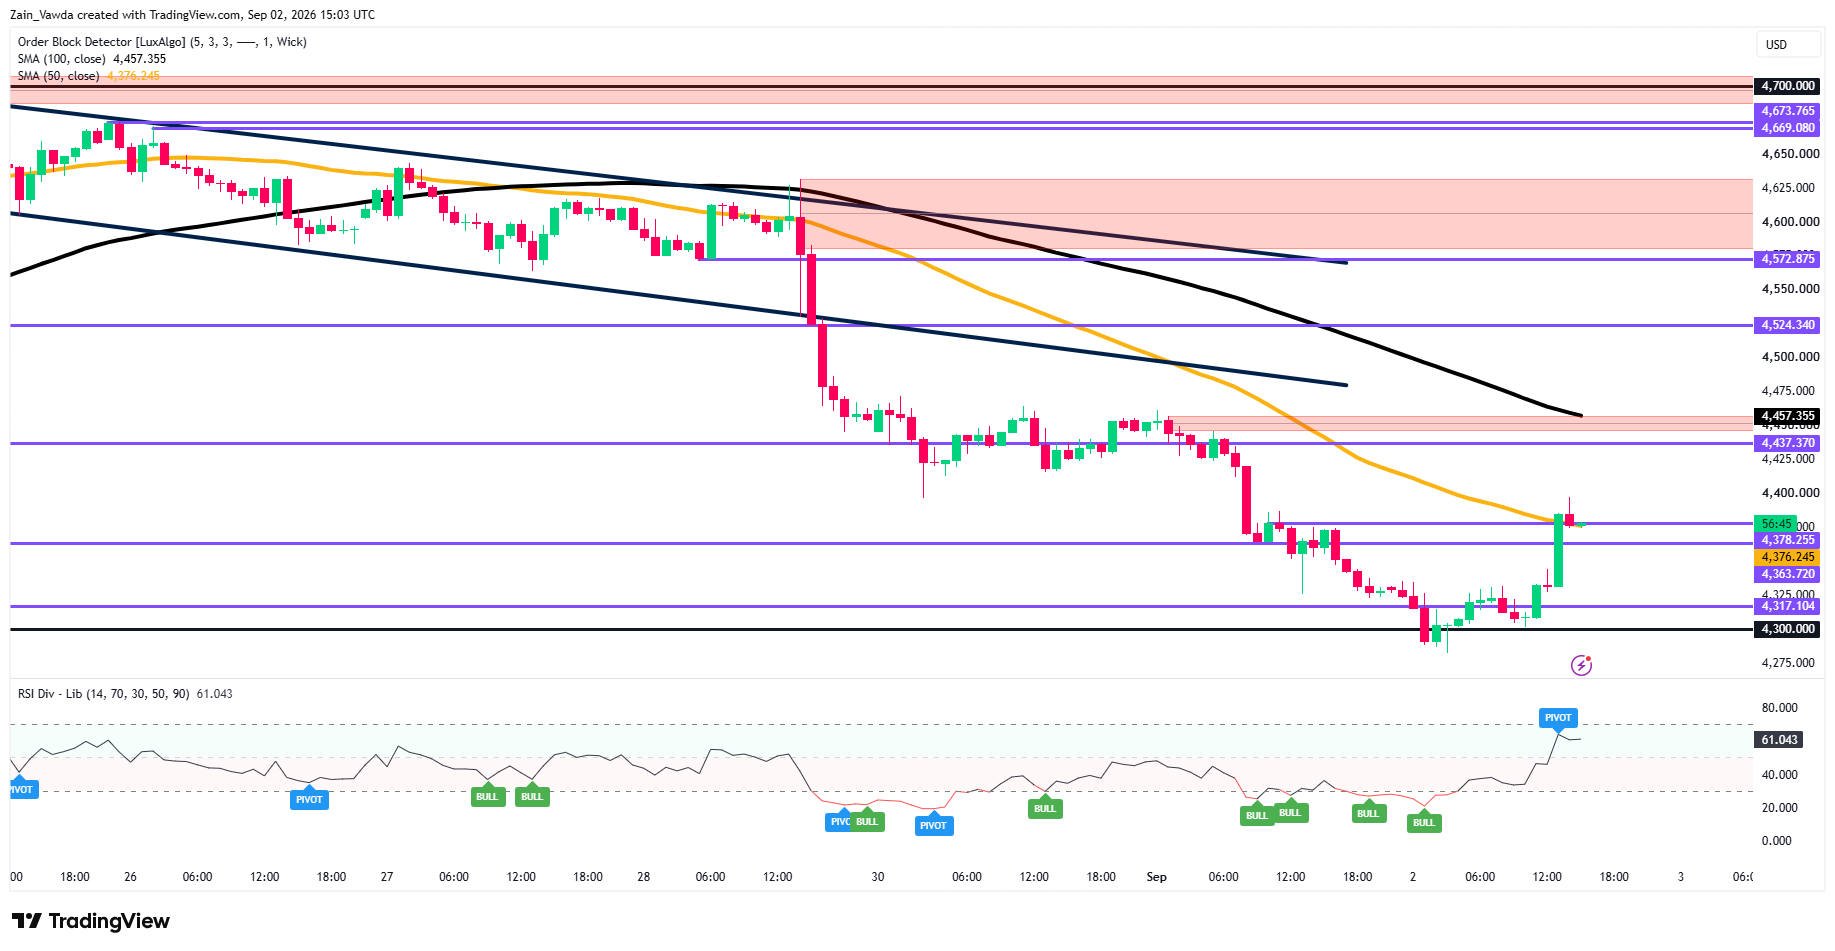
Gold (XAU/USD) One-Hour Chart, September 2, 2026
Source: TradingView
The bounce is real, but it is running straight into resistance.
Gold has reclaimed the 50-period average around $4,376, which is encouraging, yet it is still well below the 100-period average near $4,457, which is falling, a sign the bigger trend is still down.
Short-term momentum (RSI) has turned up sharply from oversold, while on the higher timeframe it is only just lifting off the floor.
In plain terms: this looks like a relief bounce, not a confirmed turn. The first real test is $4,437, the support gold lost on the way down, which now becomes resistance on the way back up.
Bull / Base / Bear into Friday’s payrolls (NFP)
| Case | Trigger | Implications for Gold Prices |
|---|---|---|
| Bull | Soft NFP (echoing today’s weak ADP); yields and the dollar keep easing | Hold above $4,376, clear $4,437, open the 100-period average ~$4,457–$4,474 then $4,524, the bounce becomes a bottom |
| Base | Traders sit on their hands and wait for the data; today’s bounce holds but doesn’t extend | Chop between $4,363 support and $4,437 resistance into Friday |
| Bear | Hot NFP revives the rate-hike trade; yields and the dollar turn back up | Lose $4,363, retest $4,317 and the $4,300 floor; a break there opens fresh lows toward ~$4,275 — the bounce was a dead cat |
Trader Positioning Data
Yesterday’s Positioning Edge data told the story before the drop: profitable accounts were positioned for a fall (only 47% long, so 53% short) while losing accounts stayed stubbornly bullish at 57% long and the selloff proved the smart-money lean right.
Positioning Edge Data provides a glimpse at market sentiment. Tracking crowded positions and smart money alignment helps investors spot extreme imbalances that often trigger price reversals or strong trends.


