Wednesday's Federal Reserve rate decision follows a familiar pattern in futures markets, but this week's setup is unusual. From a sharp swing in rate-hike expectations to a VIX curve still signalling calm, traders have plenty to watch.
At the June meeting, the Fed opted to maintain an unchanged stance for a fourth straight month, leaving the benchmark Fed funds rate at 3.50%-3.75%.
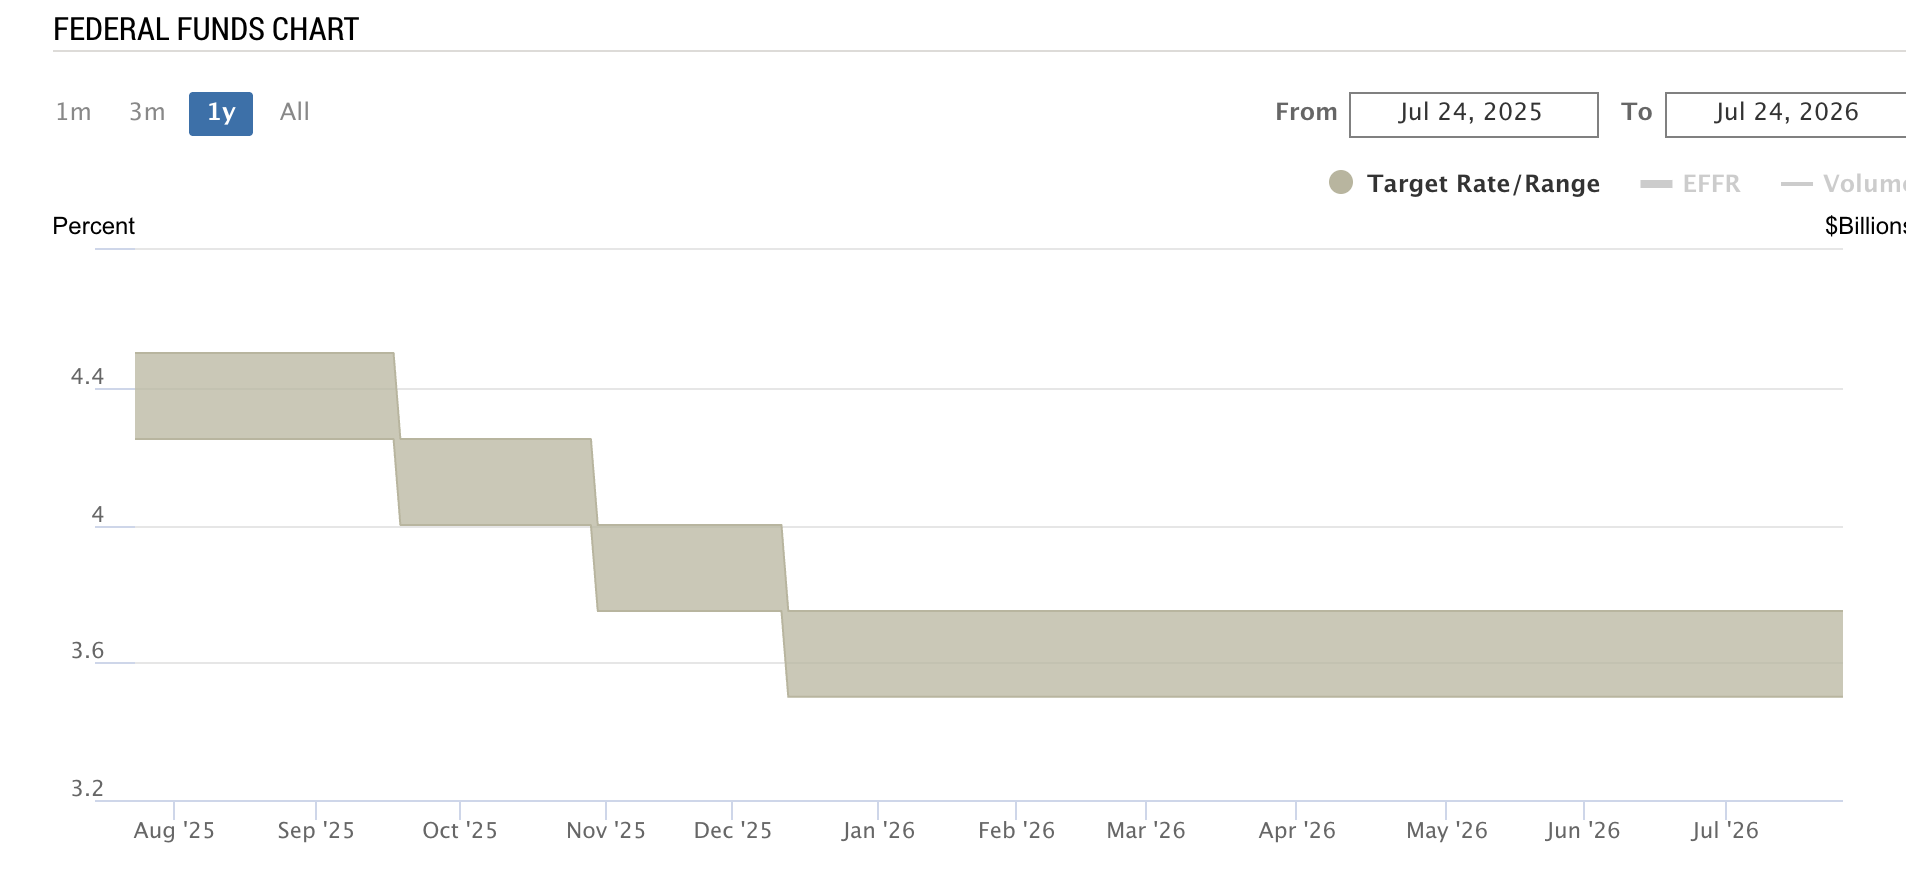
Source: St. Louis Fed
Futures traders currently price 62.1% odds of another pause at the July 28-29 Federal Open Market Committee (FOMC) meeting, trimmed down from the 70.1% odds seen a month ago.
Fifth Third Commercial Bank Chief U.S. Economist Bill Adams sees a pause-decision loading, but stated that the financial markets will likely focus on the committee’s assessment of core inflation, since the Fed has ended forward guidance.
The policy statement will likely lay out another mixed picture of inflation’s drivers. On the one hand, good news from relatively tame house prices and rent increases, and from the dissipating impact of 2025’s tariff hikes. On the other, bad news from rebounding energy prices as disruptions to Mideast and Russian exports resurface; new tariffs; AI-related pressure on electronics prices; and labor supply bottlenecks pushing up prices of services like home health care and nursing care. Bill Adams, Chief U.S. Economist at Fifth Third Commercial Bank
Not a Typical ‘Hold’ Week: Odds Moved a Lot
Before getting into historical patterns, it's worth establishing how unusual this particular Fed week has been. As of July 20, CME's FedWatch tool priced just a 16% chance of a July hike, and by July 22, that probability had more than tripled to 34.7%, driven largely by the Iran conflict pushing oil and inflation-expectation measures higher.
Thus, the ES and NQ traders spent the back half of July repricing a live hike risk that has since mostly, but not entirely, receded. That whipsaw in rate expectations is itself a data point: Futures markets head into Wednesday after rapidly pricing out the chance of a rate hike. That leaves markets vulnerable to sharp moves if the Fed's decision or guidance catches traders off guard.
No Dot Plot This Meeting; FOMC Statement Carries More Weight Than Usual
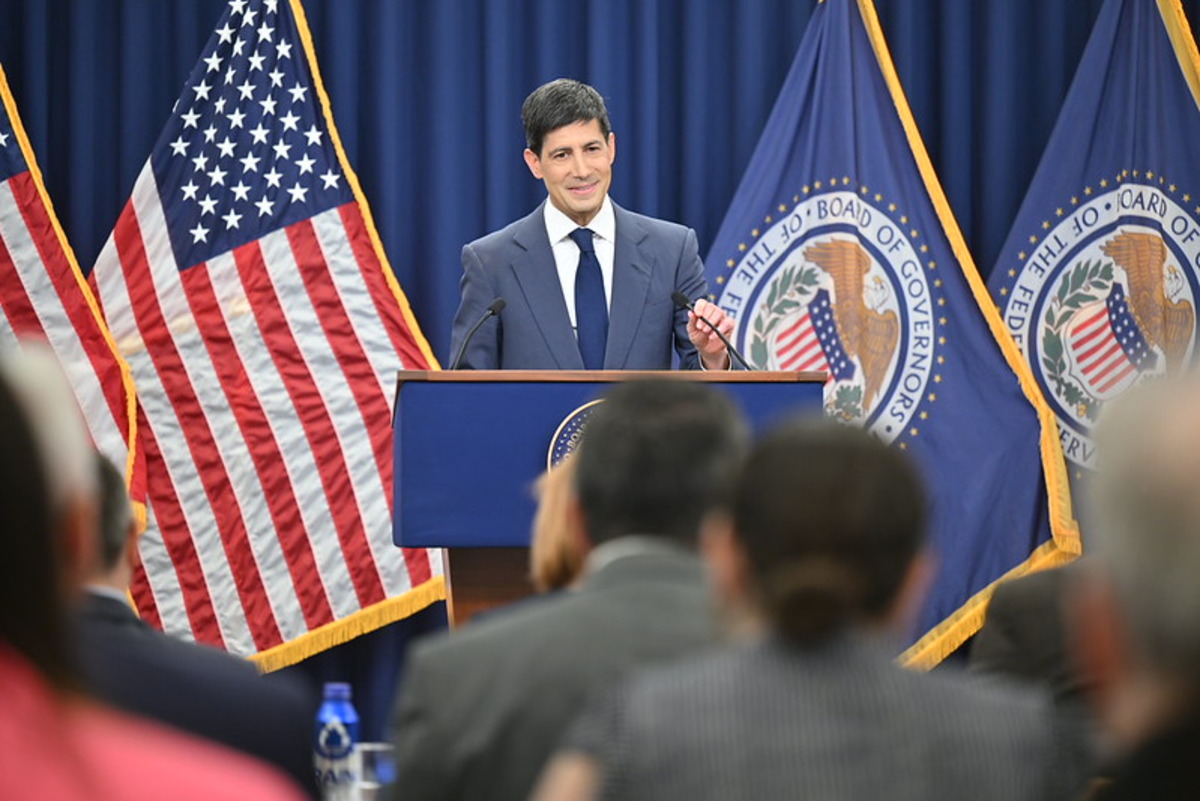
July is one of only four FOMC meetings each year that does not include a Summary of Economic Projections (SEP) or an updated dot plot. The policy statement is also typically shorter than at projection meetings, such as June and September, reflecting Fed Chair Kevin Warsh's preference for limiting forward guidance and allowing markets to draw their own conclusions from incoming economic data. At the June meeting, Warsh's first as Fed chair, policymakers trimmed the statement considerably, dropping language that implied an easing bias.
That matters mechanically for ES and NQ traders: with no dot plot to parse, the entire market reaction concentrates into statement language and Warsh’s press conference tone. In scenarios where a hold is highly priced, the message matters more than the decision itself. Commentary on inflation, employment, and the appetite for a September hike is likely to move the S&P more than the rate decision alone.
Both profitable and unprofitable traders are split exactly 50/50 between long and short, according to MarketFramework's Positioning Edge tool. If directional bias doesn't separate winners from losers, the edge in this instrument almost certainly lies elsewhere: timing, position sizing, entry/exit discipline, holding period, or risk management, rather than in which side of the market traders are on.
Historical Reaction Range: What ‘Normal’ Looks Like
Historically, volatility is concentrated in the 30 minutes around the press conference rather than the statement release itself. That's a useful baseline for ES andNQ traders sizing Wednesday's session. Expect the bulk of the real move to land closer to 2:30 p.m. ET, not 2:00 p.m., and expect the day's realized range to sit meaningfully above a typical Wednesday.
How NQ Futures Moved Around Fed Decision Days
| Meeting dates | % Change in NQ futures in previous Session | % Change in NQ futures on D-day | Range in which NQ moved on D-day | % Change in futures a day after the Fed decision |
|---|---|---|---|---|
| July 29–30, 2025 (hold decision; no SEP) | -0.17% | +0.12% | 332.50 pts | -0.49% |
| Sep 16-17, 2025 (25bp cut; SEP released) | -0.12% | +0.23% | 311 pts | +0.98% |
| Oct. 28-29, 2025 (25 bps cut; no SEP) | +0.77% | +0.38% | 330.50 pts | -1.45% |
| Dec. 9-10, 2025 (25bp cut; SEP released) | +0.14% | +0.38% | 342 pts | +0.67% |
| Jan 27-28, 2026 (hold decision; no SEP | +0.87% | +0.32% | 355.75 pts | -0.60% |
| March 17-18, 2026 (hold decision; SEP released | +0.50% | -1.46% | 645 pts | -0.29% |
| April 28-29, 2026 (hold decision; no SEP | -1.00% | +0.58% | 320 pts | +1.00% |
| June 16-17 (hold decision; SEP released) | -1.78% | -1.04% | 661.50 pts | +2.40% |
How ES Futures Moved Around Fed Decision Days
| Meeting dates | % Change in ES futures in the previous session | % Change in ES futures on D-day | Range in which ES moved on D-day | % Change In ES futures a day after Fed decision |
|---|---|---|---|---|
| July 29–30, 2025 (hold decision; no SEP) | -0.26% | -0.15% | 68.50 pts | -0.34% |
| Sep 16-17, 2025 (25bp cut; SEP released) | -0.18% | -0.13% | 75.50 pts | +0.52% |
| Oct. 28-29, 2025 (25 bps cut; no SEP) | +0.25% | -0.04% | 69.75 pts | -0.97% |
| Dec. 9-10, 2025 (25bp cut; SEP released) | -0.11% | +0.64% | 77.25 pts | +1.09% |
| Jan 27-28, 2026 (hold decision; no SEP | +0.39% | -0.02% | 65.75 pts | -0.21% |
| March 17-18, 2026 (hold decision; SEP released | +0.30% | -1.4% | 159.50 pts | -0.26% |
| April 28-29, 2026 (hold decision; no SEP | -0.50% | -0.04% | 59.50 pts | +1.06% |
| June 16-17 (hold decision; SEP released) | -0.6% | -1.3% | 150 pts | +1.1% |
Across the last eight FOMC meetings, day-of moves in ES and NQ have mostly been modest. Six of eight sessions landed within a tight range (roughly ±0.7% for ES, similarly contained for NQ), undercutting the assumption that Fed day is reliably a high-volatility event. Two meetings, March and June 2026, are clear outliers, with ranges roughly double the rest of the sample; both were hold decisions paired with a dot-plot release, but June's outsized NQ range in particular likely reflects a concurrent bout of AI-driven tech volatility rather than the rate decision itself. It is a reminder that the D-day range can be contaminated by unrelated same-day catalysts.
This week’s rate decision comes just ahead of the next wave of big tech earnings, a combination that could amplify market volatility.
Two other patterns stand out: in five of eight meetings, the next-day move was larger than the decision-day move itself, suggesting markets often keep digesting Fed language well past the announcement window. Pre-meeting positioning showed no consistent directional drift, with the "previous session" moves swinging from -1.78% to +0.87% with no reliable pattern. Together, the data argues for a more tempered framing than "FOMC days are always volatile": most meetings are unremarkable, the truly outsized ones are often driven by a specific catalyst (a dot plot, a concurrent macro event) rather than the decision alone, and the real story may be how markets behave in the 24 hours after the statement, not just during it.
VIX Term Structure Says the Options Market Isn't Bracing Hard
As of July 24's close, the VIX term structure remains in contango — the normal, calm-market state — with spot VIX at 18.58 against VIX3M at 20.51, a ratio that shows no sign of near-term stress premium building into Wednesday. That's a meaningful cross-check on the "outsized move" thesis. If the options market genuinely expected a violent surprise, the curve would typically flatten or invert into backwardation as front-month vol gets bid above further-dated contracts. A steady contango heading into FOMC suggests professional options positioning still sees this as a "digest and move on" event rather than a genuine tail-risk week.
The whipsawed rate odds, the historical data showing most FOMC days are unremarkable, and the calm VIX curve leads into a single practical takeaway: this week's real risk isn't the decision itself, it's the collision of the Fed statement with earnings flow.


