The dollar enters the week starting July 26 having done precisely what last week’s structure suggested it would.
The failed breakdown at 100.617 held, the bear trap resolved higher, and the index has cleared the full resistance ladder — 100.907, 101.021 and 101.30 — to trade near 101.45, an over three-week high. Brent’s break above $100 did the work that soft CPI had undone a fortnight earlier, rebuilding the inflation premium and dragging the 10-year to 4.71%, its highest since January 2025.
The blackout now lifts into the busiest policy week of the quarter. Three of the DXY’s six components carry a central bank decision inside 72 hours, and the Fed’s preferred inflation gauge arrives after the Fed has already spoken.
Daily Timeframe
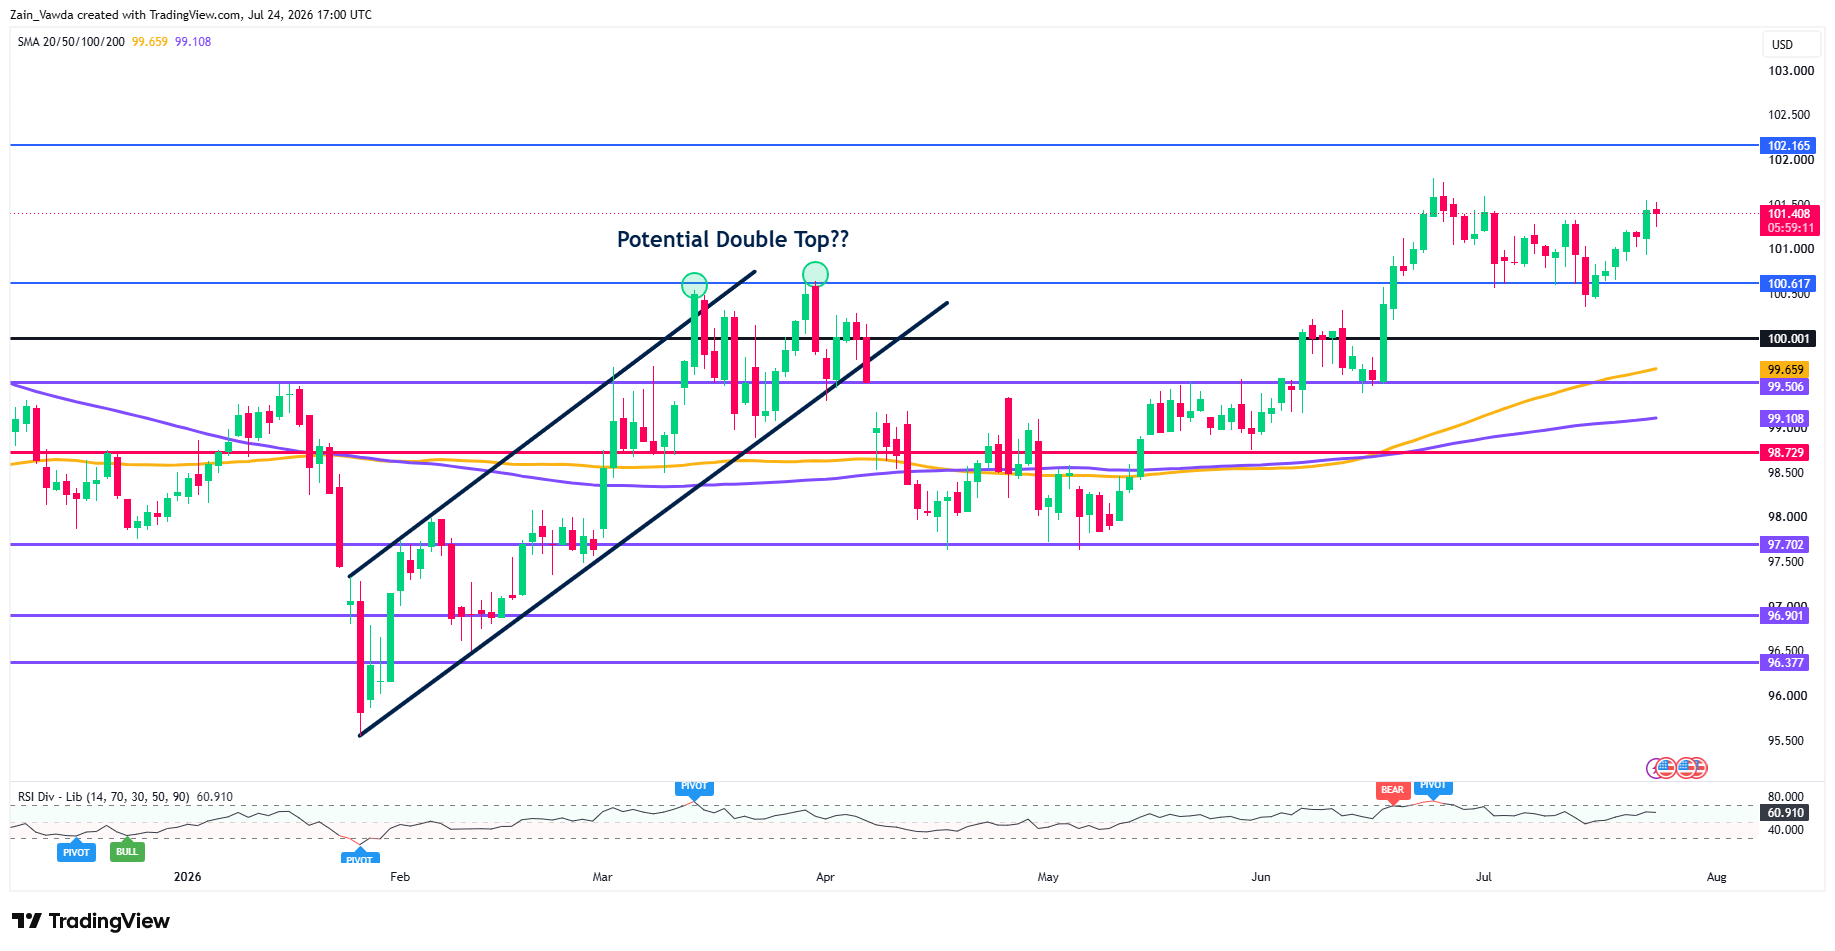
US Dollar Index (DXY) Daily Chart, July 24, 2026
Source: TradingView
The trap is confirmed. Wednesday’s failed breakdown below 100.617 last week has now been paid in full, and the daily structure has shifted from a pullback within an uptrend to an outright resumption of it.
Price is extended above both the rising 100-day and 200-day moving averages, which continue to sit well beneath the market.
That leaves 101.80 — the 52-week high — as the last meaningful obstacle before 102.165, the level flagged as the upper objective in last week’s note. There is very little structure between the two.
The risk is momentum, not direction. Five sessions of gains into a policy event is exactly the configuration that produces a sell-the-fact reversal on a hawkish hold that everyone already owns.
The defence line has moved: 101.30 is now first support, and a daily close back beneath it would argue the oil-driven leg has exhausted itself before the Fed even speaks.
Four-Hour Timeframe
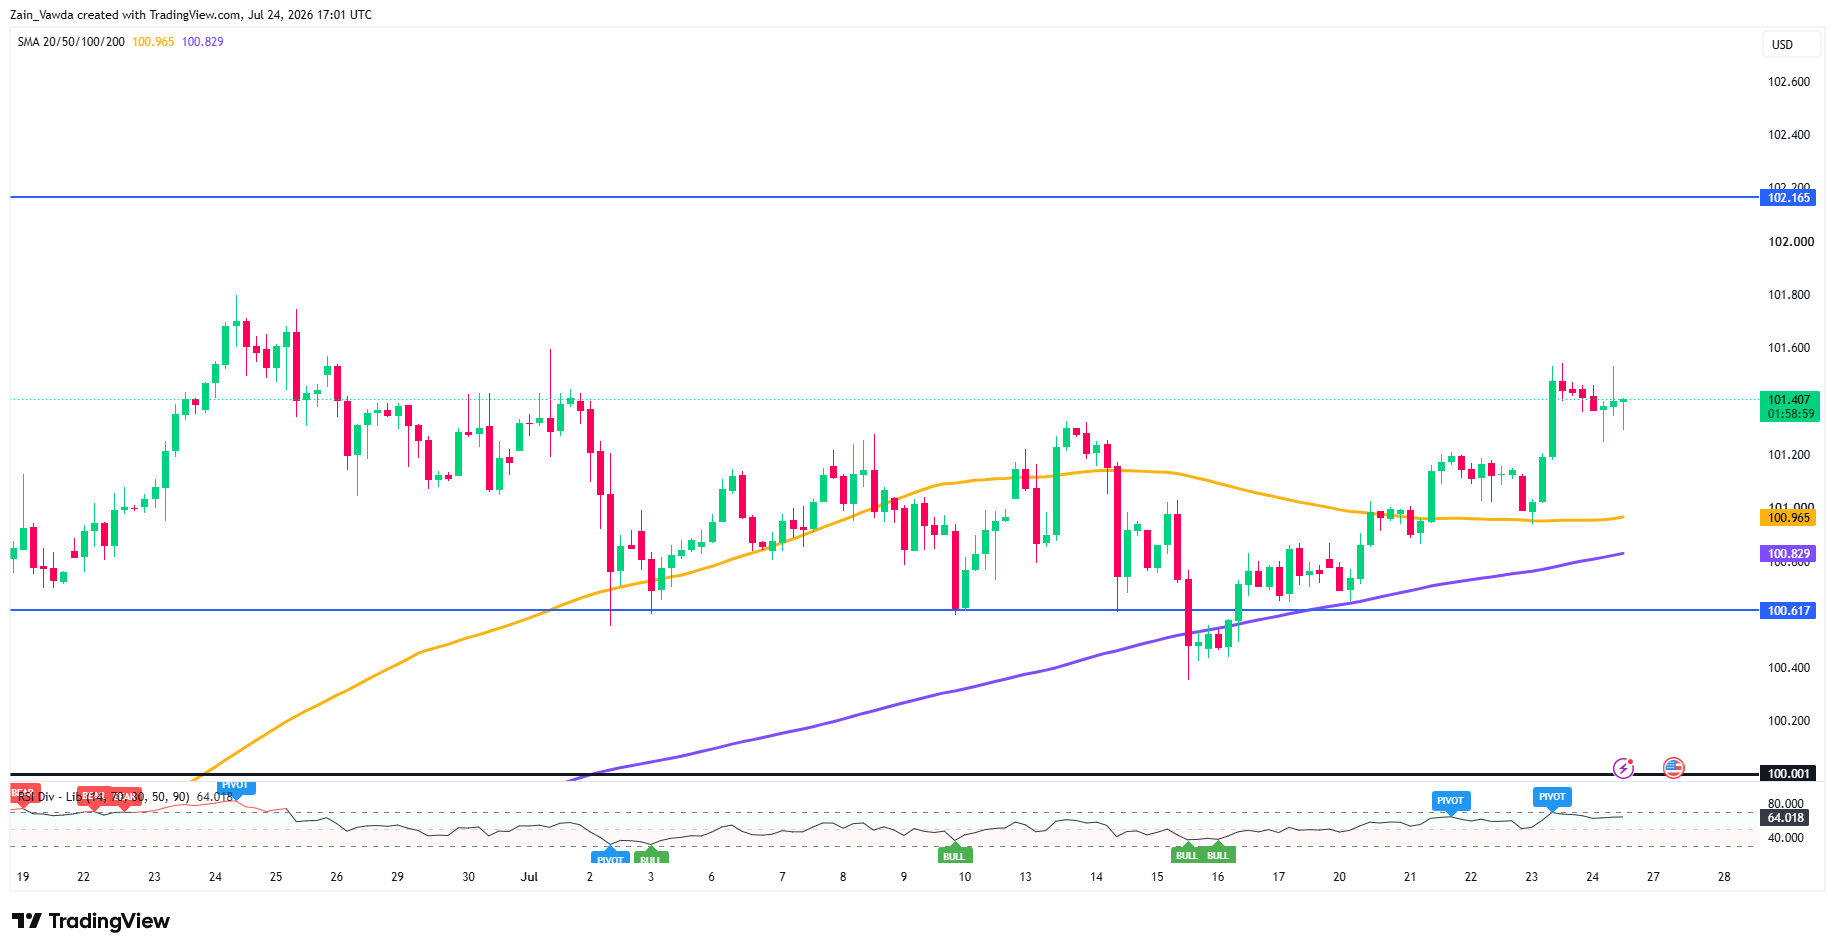
US Dollar Index (DXY) Four-Hour Chart, July 24, 2026
Source: TradingView
The H4 did its job textbook-style. The 100.617 horizontal in confluence with the 200-period MA at 100.609 held as the well-defined line it was billed as, and the 101.021 MA cap that stalled every bounce a week ago has been broken and left behind.
The question for the coming week is whether that same 101.00–101.30 pocket now works in reverse as demand. Old resistance turning support is the cleanest confirmation that this is trend rather than squeeze, and it is where any pre-FOMC pullback should be judged.
Above 101.80 the four-hour chart has no reference point until 102.165. Traders should expect thin, fast conditions in that gap — it is not a zone to be sizing into at market.
One-Hour Timeframe
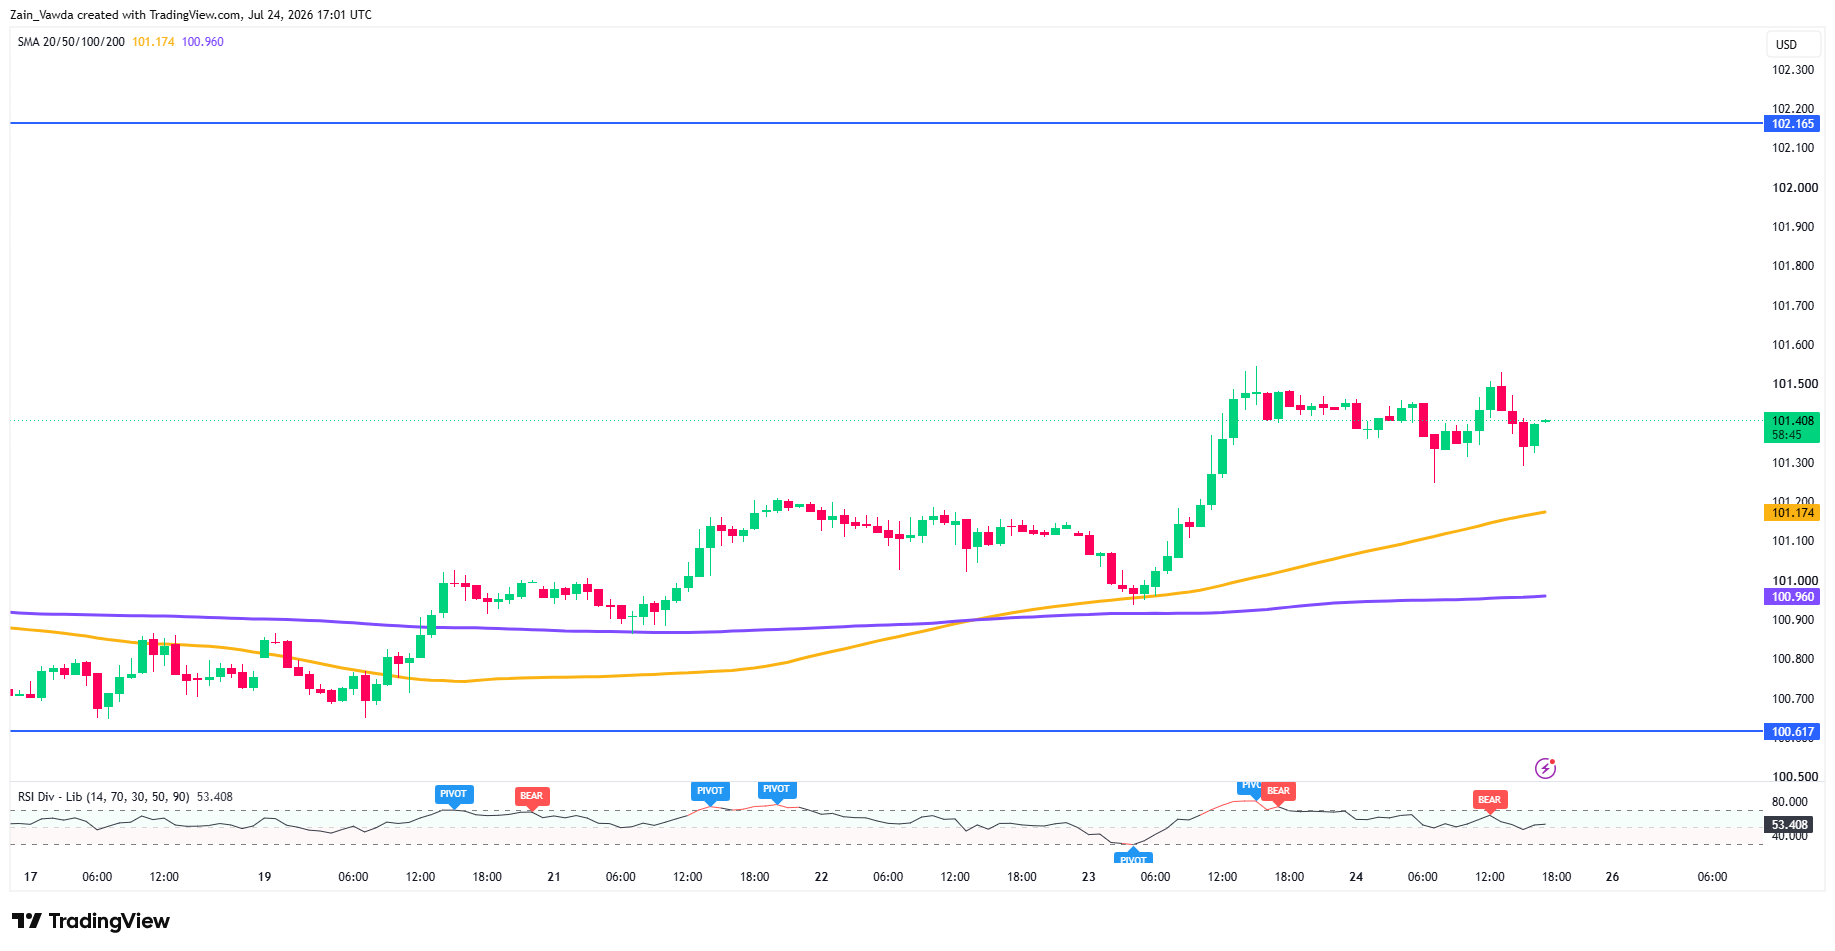
US Dollar Index (DXY) One-Hour Chart, July 24, 2026
Source: TradingView
Last week’s compression between 100.60 and the 100.835–100.907 cluster resolved to the upside and has since become a grind rather than an impulse, with each yield-driven leg higher producing smaller follow-through than the last.
Into the weekly close, the tell is today’s US flash PMI. A firm print that produces a new high keeps the structure clean. But a firm print that produces a lower high — dollar strength failing on good news — is the first genuine warning that the market is done buying the inflation story ahead of the Fed.
The Week’s Drivers
With the blackout over, three inputs matter.
First, the Fed decides before it sees the data. The FOMC announces Wednesday July 29 at 14:00 ET with Federal Reserve Chair Kevin Warsh’s press conference at 14:30, and this meeting carries no Summary of Economic Projections. June PCE does not land until Thursday July 30, the day after. With May headline PCE at 4.1% and core at 3.4%, Warsh has to write a statement without the number that would justify it. Markets price roughly a one-in-three chance of a July hike and better than 78% for September.
That asymmetry matters: a hold with hawkish September language is the base case and is largely in the price, while an actual hike is the tail that takes the index through 101.80 in a single session.
Second, five of the six components have their own catalyst. The euro carries 57.6% of the index and just delivered a substantial upside surprise — the eurozone flash composite printed 51.9 against 50.3 expected, with services at 51.6 versus 49.8 — while a September ECB hike sits close to 90% priced. Flash eurozone GDP and unemployment follow on Thursday.
The BoE decides Thursday July 30 into a surprise UK retail sales beat of 1.0% against 0.3% expected. The BoJ concludes Friday July 31 with its quarterly outlook, and this is the single largest downside risk to DXY on the board: USD/JPY sits at 163.80, a four-decade yen low, with Finance Minister Satsuki Katayama stating Japan stands ready to act decisively and the US Treasury pressing the BoJ to keep raising. A yen intervention or a hawkish BoJ surprise hits 13.6% of the index directly and instantly.
Third, the oil pass-through is now the dollar’s dominant input. Brent settled above $100 for the first time since May and is tracking a 13.5% weekly gain; Section 301 tariffs covering 99.4% of US imports took effect Friday, with oil, gas and fertilizer carved out precisely because the administration is trying not to compound the shock.
The regime worth internalising is that crude rallies are now dollar-positive, because they transmit through the hike channel rather than the risk-off channel. Any credible de-escalation removes that bid quickly, and Trump has been signalling in both directions.
What the Dollar Is Signalling for the Wider Tape
This is the part worth carrying into next week regardless of where the index closes. Right now DXY higher, gold lower, Nasdaq lower and yields higher are not four separate trades.
They are one trade — an inflation repricing — wearing four different tickers. Gold at $4,040 falling on a geopolitical escalation is the clearest evidence of it: the real-yield channel is beating the haven bid.
That gives traders a specific tripwire. As long as the dollar and gold move inversely, the market is pricing an inflation problem, and the correct read across ES, NQ and GC is the same one. The moment DXY rallies while gold rallies with it, the market has stopped pricing inflation and started pricing crisis — haven demand for both at once.
That correlation break, not any single level, is the signal that the character of this tape has changed, and it is the one worth watching through the FOMC.


