The dollar limps into the week starting July 19 having survived its sternest test since May.
Soft CPI and PPI prints gutted the July hike trade, yet the index refused to break down — a mid-week flush to 100.35 was bought aggressively, and price heads into the weekly close back above the pivotal 100.617 level.
With the Federal Reserve now in blackout ahead of the July 28–29 FOMC, geopolitics and second-tier data will steer the tape.
Daily Timeframe
US Dollar Index (DXY) Daily Chart, July 17, 2026
Source: TradingView
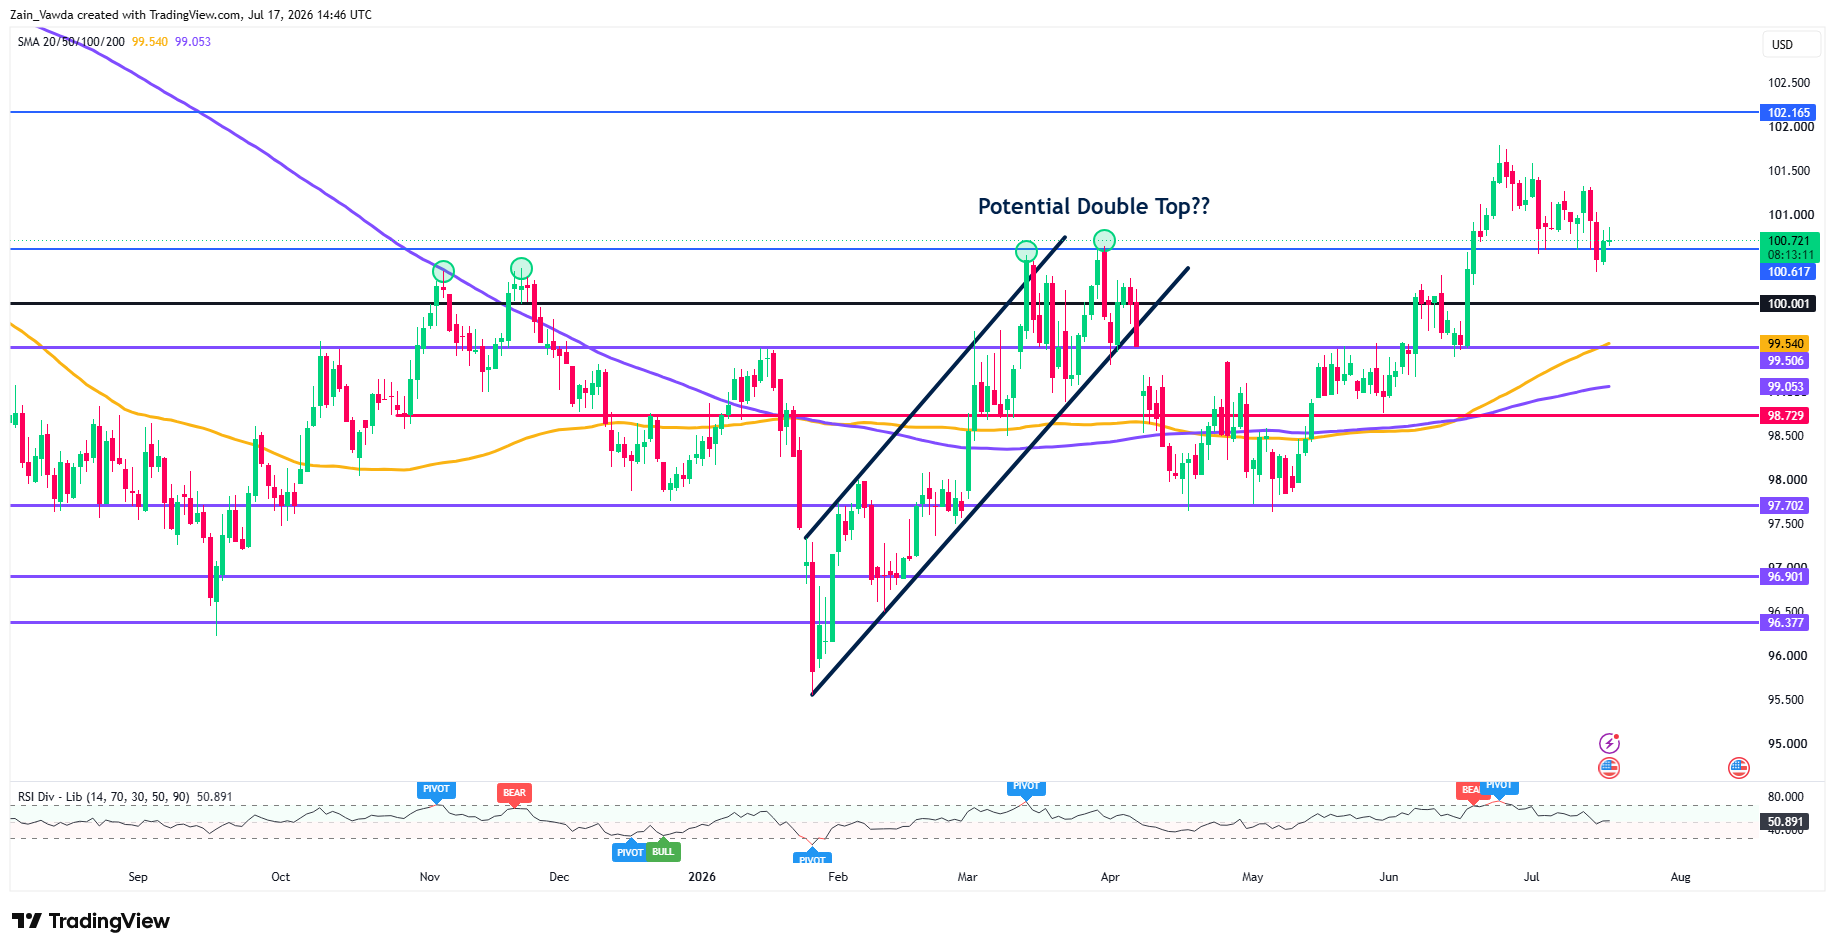
The daily chart tells the story of a failed breakdown.
Wednesday's push below 100.617 found no follow-through, and the swift reclaim leaves a potential bear trap on the chart — historically a springboard for counter-moves.
The broader structure remains a pullback within an uptrend: the 100-day MA (99.540) and 200-day MA (99.053) are both rising well beneath price, and RSI has reset to a neutral 50.9 from July's overbought extremes.
Bulls need a decisive push back through 101.00 to confirm the trap; a weekly close back below 100.617 would instead mark a fakeout of the fakeout and open 100.00, then 99.540/99.506.
Four-Hour Timeframe
US Dollar Index (DXY) Four-Hour Chart, July 17, 2026
Source: TradingView
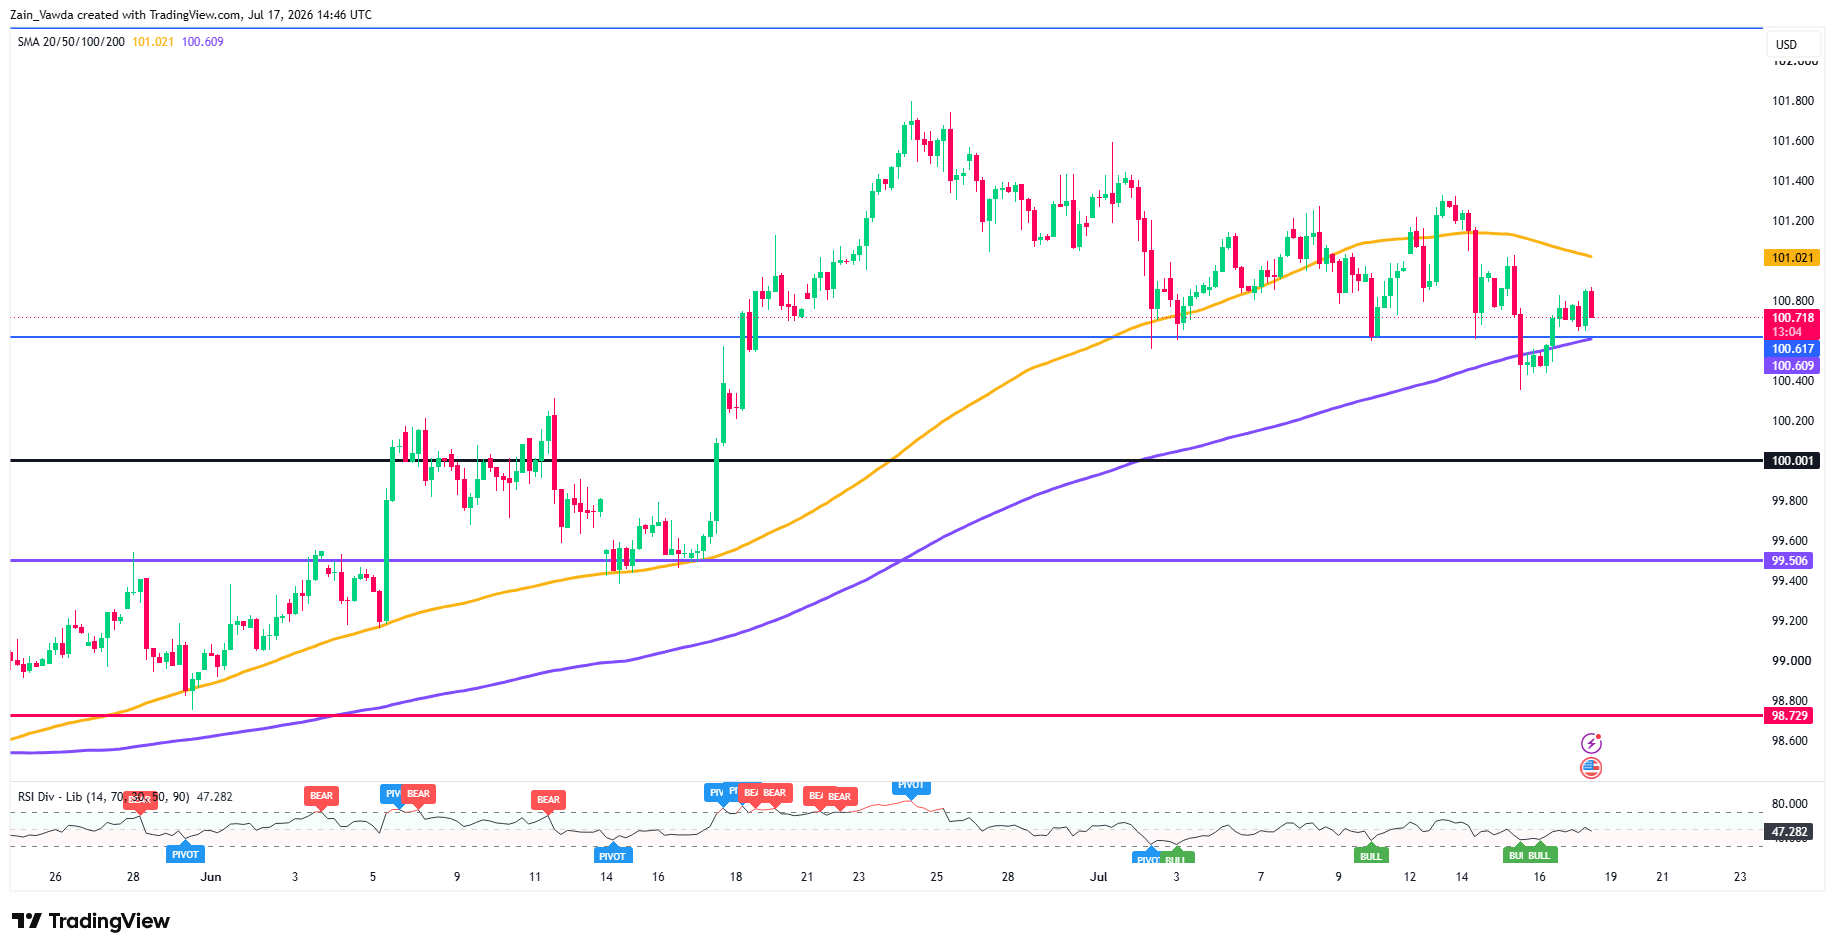
The H4 recovery has legs but faces its first real test. Price reclaimed the 200-day MA (100.609), which now provides dynamic support in confluence with the 100.617 horizontal — a well-defined line for the week.
Overhead, the 100-day MA at 101.021 is rolling lower and stalls right where the psychological 101.00 handle sits, creating the week's key resistance battle.
RSI at 47 is neutral, reflecting a market awaiting its next catalyst. H4 closes above 101.02 target 101.30; rejection there keeps the corrective tone alive.
One-Hour Timeframe
US Dollar Index (DXY) One-Hour Chart, July 17, 2026
Source: TradingView
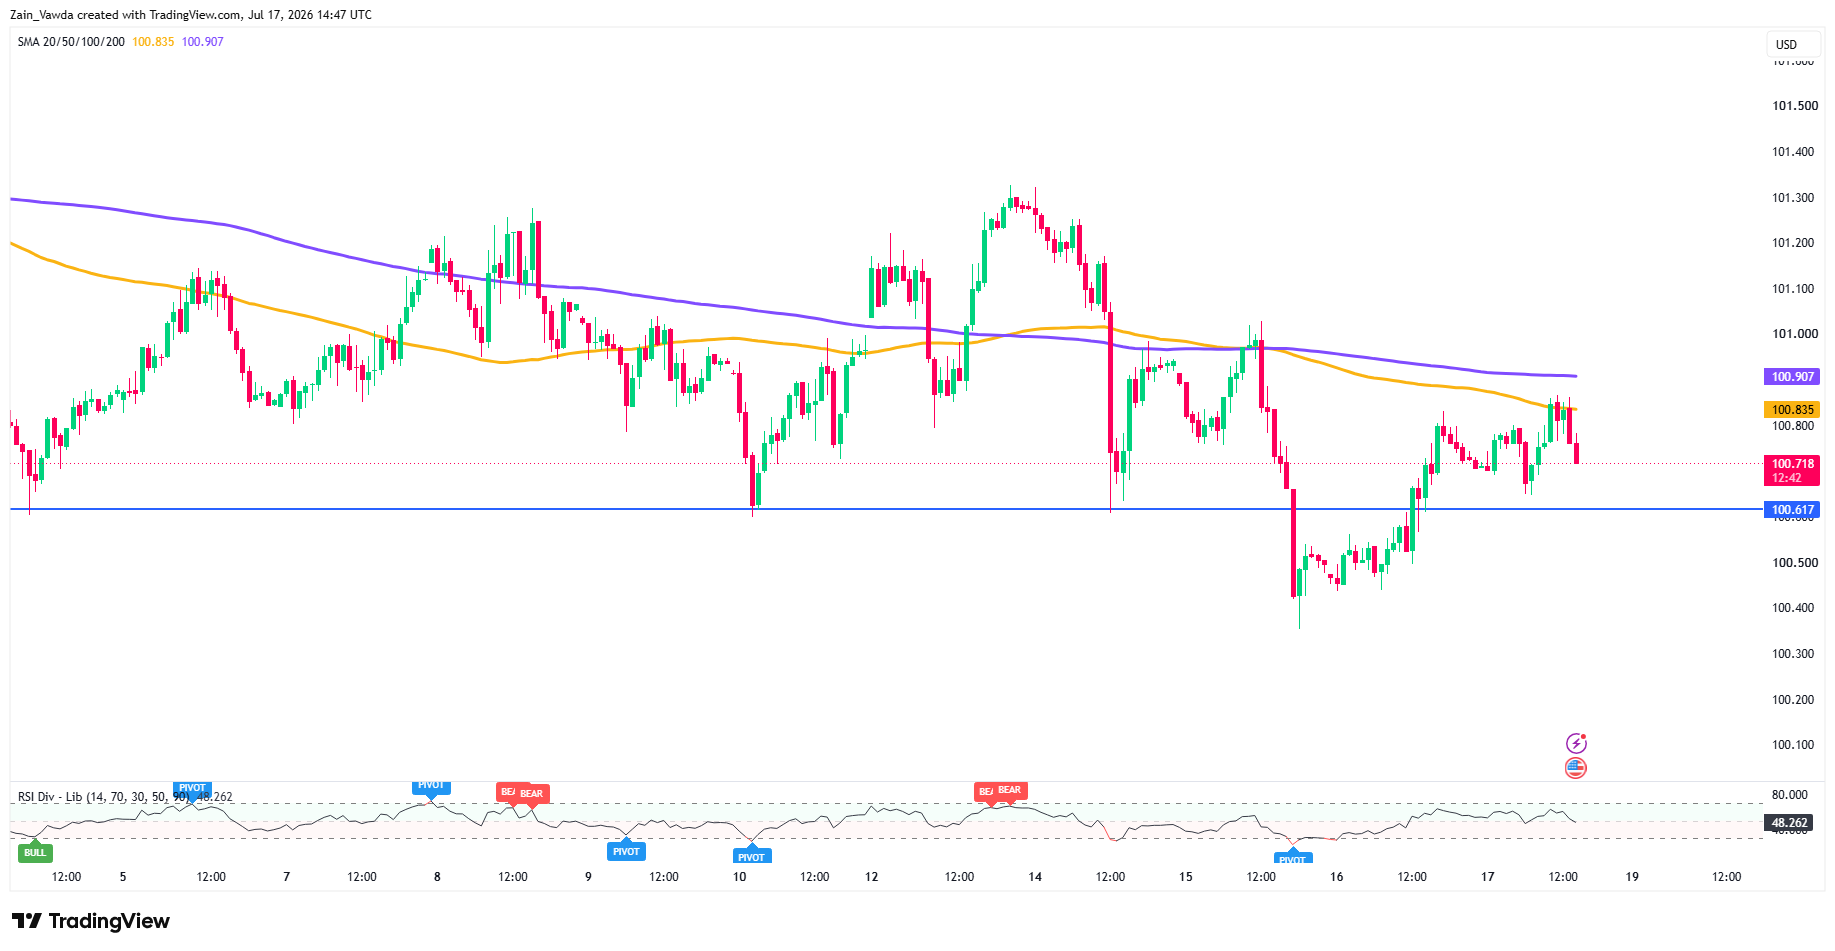
The H1 shows compression rather than trend: a tightening range between 100.60 support and the 100.835–100.907 MA cluster capping every bounce since Thursday.
RSI hovering at 48 confirms the coiling. This is a break-and-go setup — clearance of 100.91 likely accelerates into 101.00–101.02, while a loss of 100.60 revisits the 100.35 wick low quickly.
The Week's Drivers
With Fed speakers silenced, three inputs matter.
First, US-Iran: the week-long exchange of strikes has pushed oil toward one-month highs, and further escalation cuts dollar-positive on both haven flows and revived inflation risk — this remains the asymmetric upside catalyst for DXY. Any credible de-escalation removes that bid and likely sends the index through 100.35.
Second, next Friday's flash PMIs offer the last meaningful growth pulse before the FOMC.
Third, positioning: with only 11% odds on a July hike, the bar for a hawkish surprise repricing is low — markets leaning dovish into a Warsh Fed that has spent months warning on inflation is a setup that has burned dollar bears before.
Bias: Neutral-to-bullish above 100.617; the bear trap and geopolitical floor favor a rotation back toward 101.00–101.30, with 100.35 the invalidation.
Key levels — Support: 100.617, 100.35, 100.001, 99.540. Resistance: 100.907, 101.021, 101.30, 102.165.


