The U.S. Dollar Index is trading near 98.96 under the round 99.00 mark and well below the pivotal 99.50 level after a daily double top rolled over and sliced clean through 100.00.
All three timeframes point the same way: the trend is down, and the bounce off the lows looks corrective rather than a genuine turn.
The only real question is whether Friday’s Jackson Hole debut from new Federal Reserve Chair Kevin Warsh lights the fuse for the next leg lower or sparks the relief rally the chart keeps threatening.
The desk’s long-standing line still frames it: below 100.00, the market is effectively pricing the September hike back out, and the dollar with it.
Daily: The Big Picture is Bearish
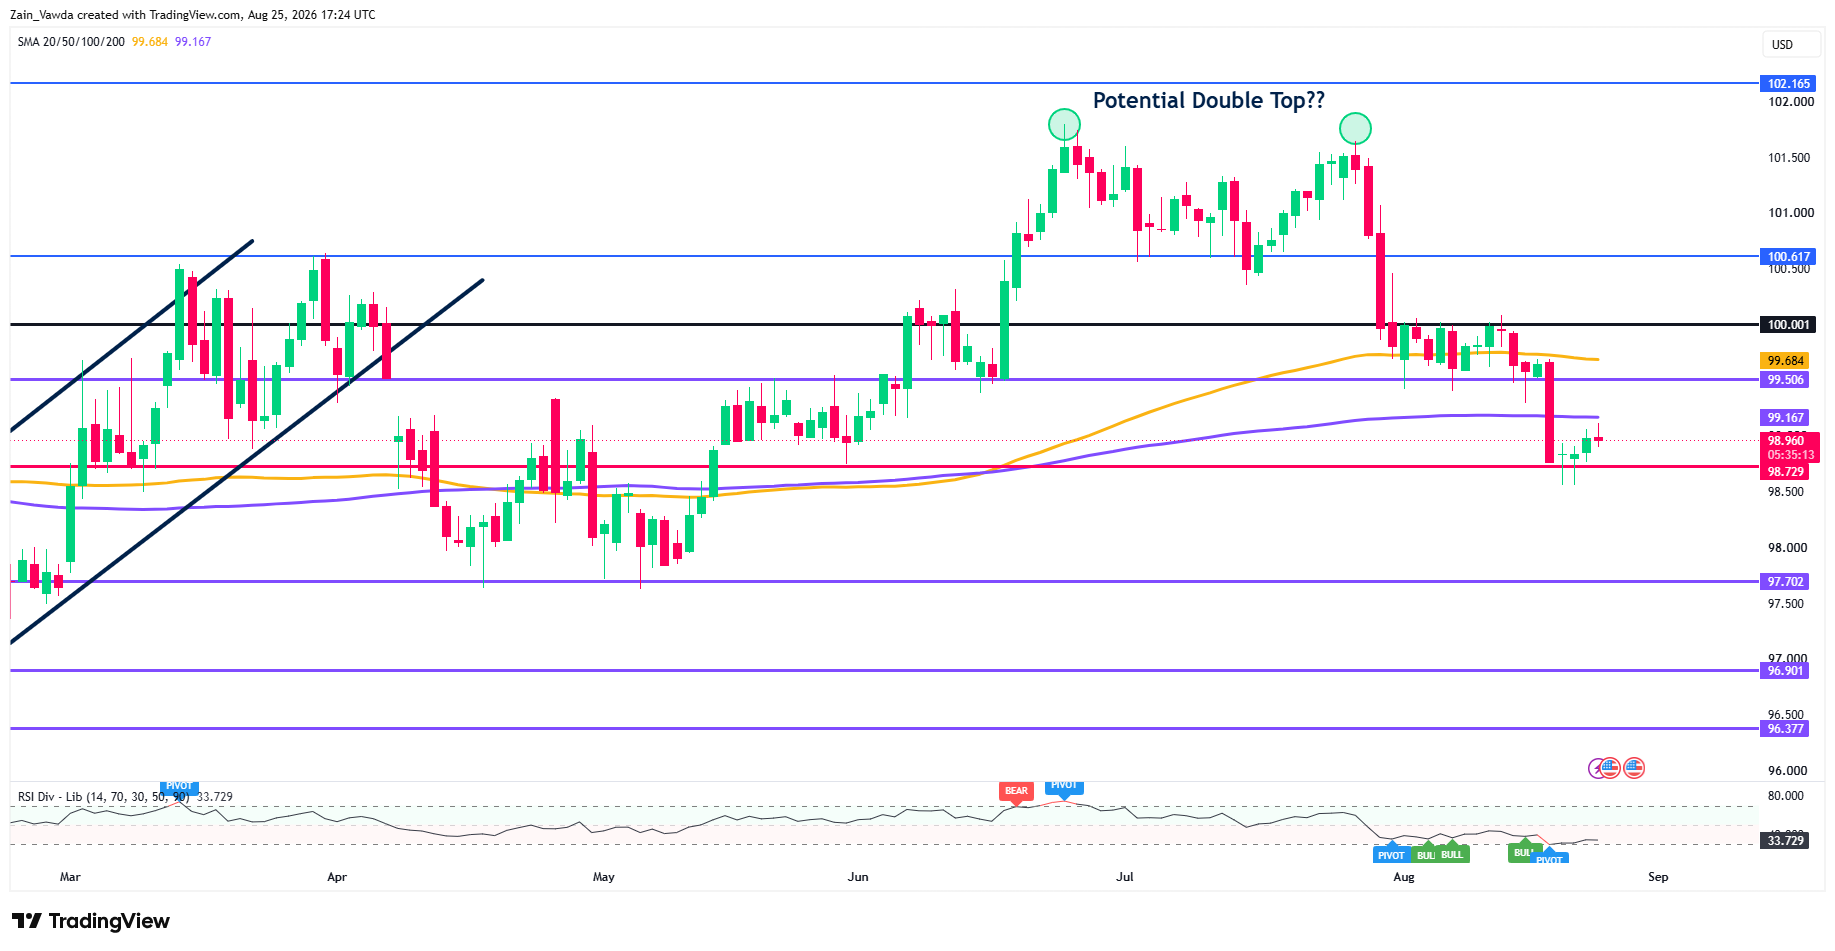
US Dollar Index (DXY) Daily Chart, August 25, 2026
Source: TradingView
The headline pattern is a double top around 101.6, built in July and August, and its neckline has given way. Price has since lost 100.00 and 99.506 and now sits below its main daily moving averages.
Daily RSI at 33.7 is weak and edging toward oversold territory but with room to fall before it’s stretched.
Support sits at 98.729; below there the chart thins out quickly toward 97.70. Resistance is 99.506, then 100.00.
H4: A Weak Bounce Inside a Downtrend
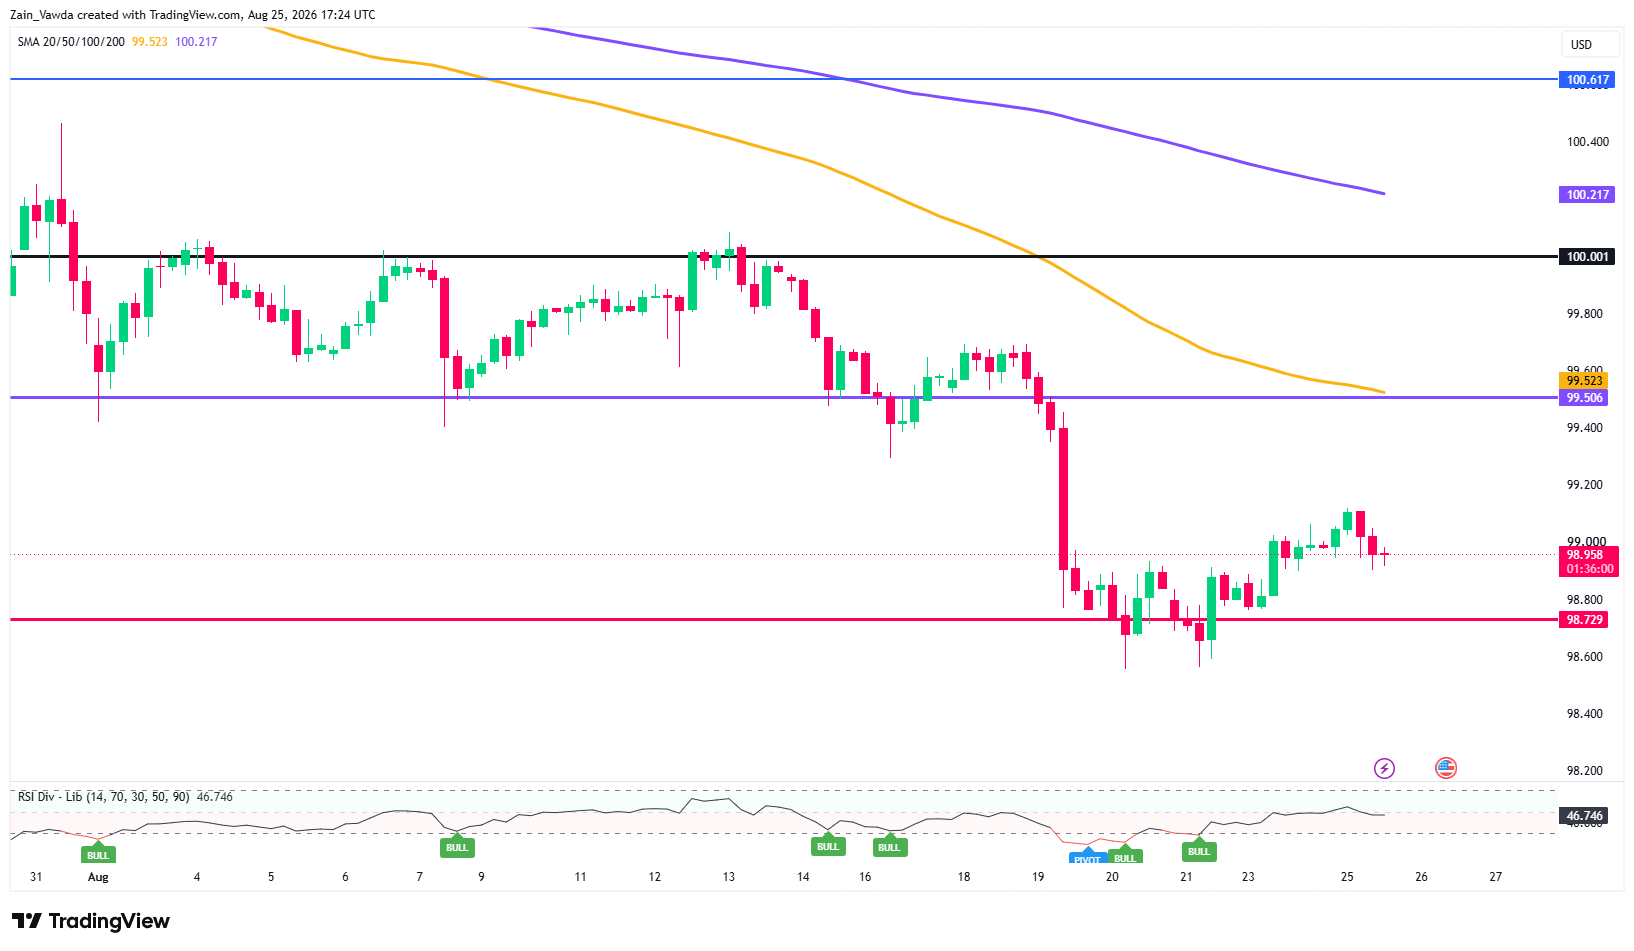
US Dollar Index (DXY) Four-Hour Chart, August 25, 2026
Source: TradingView
The H4 shows the breakdown in motion: a sharp drop on 19 August through 99.506 down to 98.729, then a shallow recovery that has stalled under a falling 50-period average near 99.52.
Lower highs, both averages sloping down, price underneath, this is a corrective bounce, not a reversal. 98.729 is the floor bulls must protect; 99.506 is the level they must reclaim to change anything.
H1: A Coil Waiting for a Catalyst
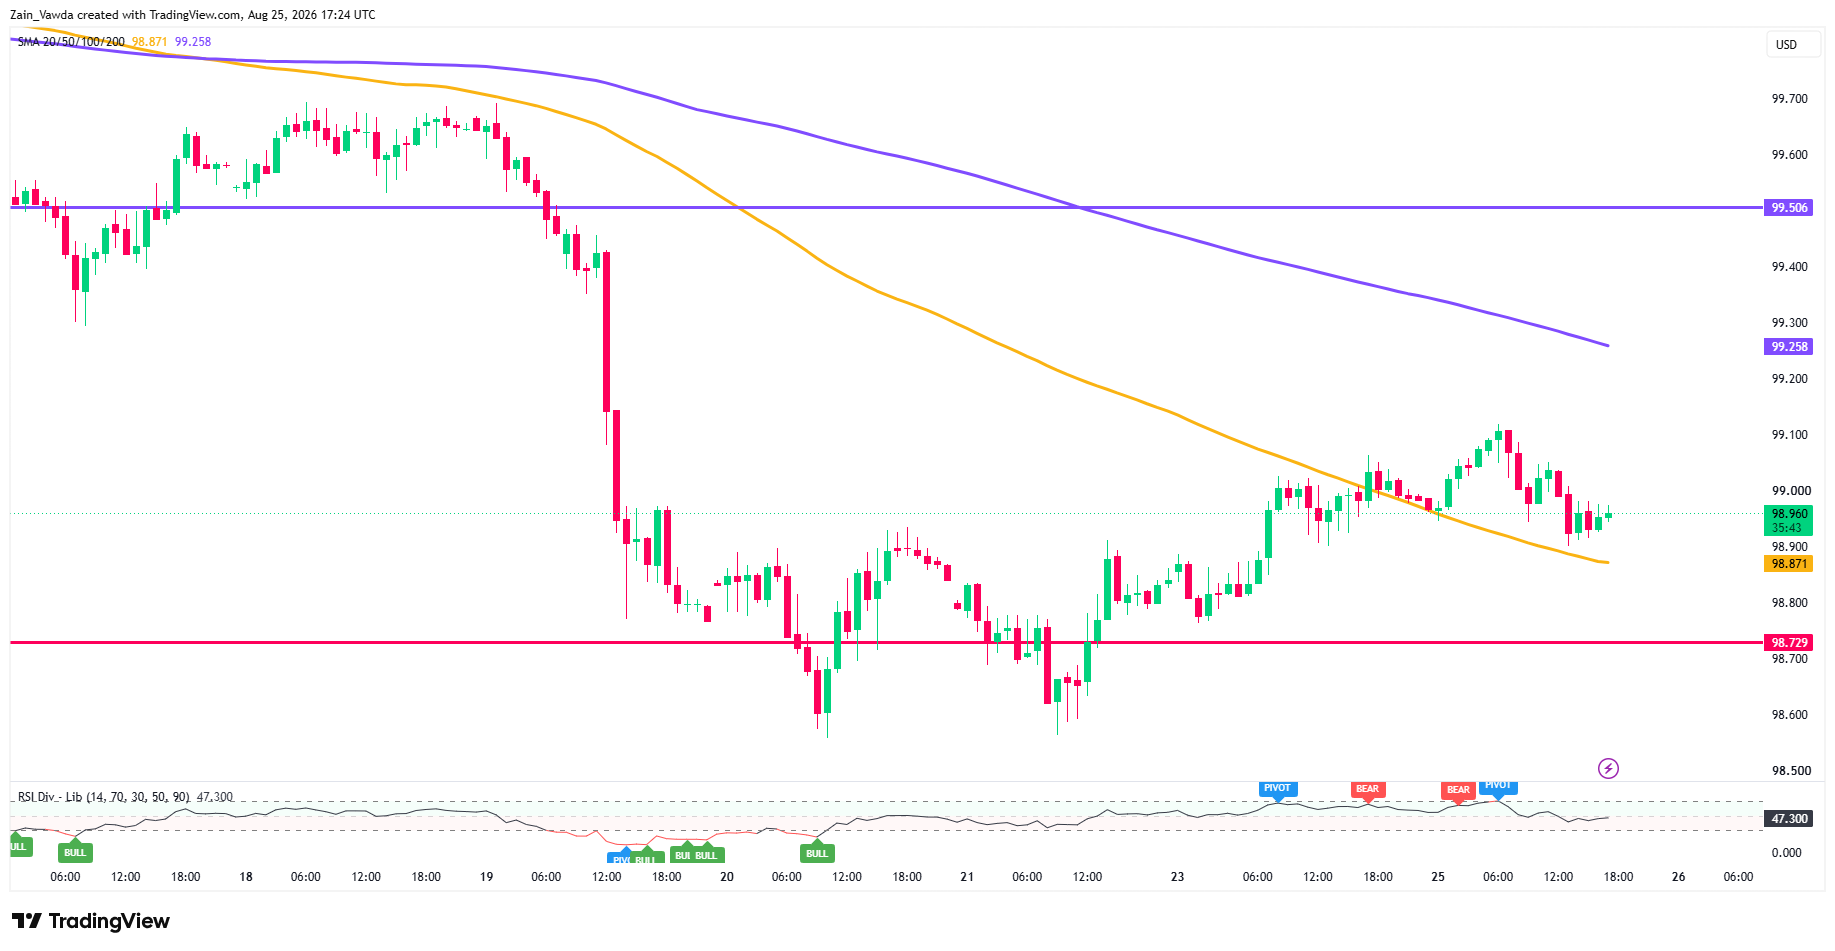
US Dollar Index (DXY) One-Hour Chart, August 25, 2026
Source: TradingView
Zoom in and the near-term picture is a tightening squeeze.
Price is pinned between a rising 100-period average at 98.871 (support) and a falling 200-period average at 99.258 (resistance), coiling right at 99.00.
RSI near 47 is neutral, with momentum pivots capping the recent highs.
Compressions like this rarely last, they resolve on a catalyst. Lose 98.871 and 98.729 is next; reclaim 99.258 and 99.506 comes back into play
How Jackson Hole Could Break the Setup
Here is why the H1 is coiling: Fed Chair Warsh scrapped forward guidance and the dot plot when he took over, so the market has less to lean on and is simply waiting.
His first keynote on Friday is the obvious trigger. A hawkish message defending a live September hike, or pushing back on the Treasury’s attempts to cap yields would hand the dollar a bid, sending DXY toward 99.506 and then a real test of 100.00; a daily close back above 100 would challenge the whole double-top story.
A minimalist or soft message, his known style leaves the dollar offered, breaks the coil lower, and opens the 97.70 target.
Wednesday’s PCE is the appetiser: a hot print supports the dollar into Friday, a soft one undercuts it. Underneath it all, the Fed–Treasury tension still leans structurally dollar-negative.
Tips for Traders
The trap this week is trading the coil too early, fading it before the event, or chasing a pre-Jackson-Hole breakout that gets faded.
The edge is patience: let PCE and Warsh resolve the 98.729–99.506 box before committing, and treat 100.00 as the regime switch it is, not an intraday level.


