
After weeks pinned inside a tightening range, Bitcoin broke out with force on Wednesday. BTC/USD tore up to roughly $69,400, its highest since early June and its biggest single-day advance since March.
In a near-vertical move that cleared the entire summer trading band in one session. The trigger was a rare pile-up of bullish news out of Washington, and the money followed it in.
What Lit the Fuse: Three Catalysts in 24 Hours
Bitwise chief investment officer Matt Hougan summed up the mood after three developments landed in quick succession.
First, the U.S. Securities and Exchange Commission unveiled a Regulation Crypto Assets proposal, simpler fundraising rules for crypto companies plus a safe-harbor framework that would lift many tokens out of the “investment contract” (securities) bucket.
Second, the Treasury said it would double its buybacks of long-dated government debt, a liquidity injection Hougan likened to a form of yield-curve control, a powerful long-run tailwind for scarce assets.
Third, the White House held a closed-door meeting with executives from Coinbase and Ripple on tokenization and moving the Clarity Act forward, with the executive branch stepping in where Congress has stalled.
The Money Confirmed It
The institutional bid turned before the news was even official. Daily net inflows into U.S. spot Bitcoin ETFs swung decisively positive at $189.3 million, led by BlackRock’s IBIT at $223.1 million. Total assets across the Bitcoin ETF complex reached about $79.3 billion, roughly 12% of Bitcoin’s market value.
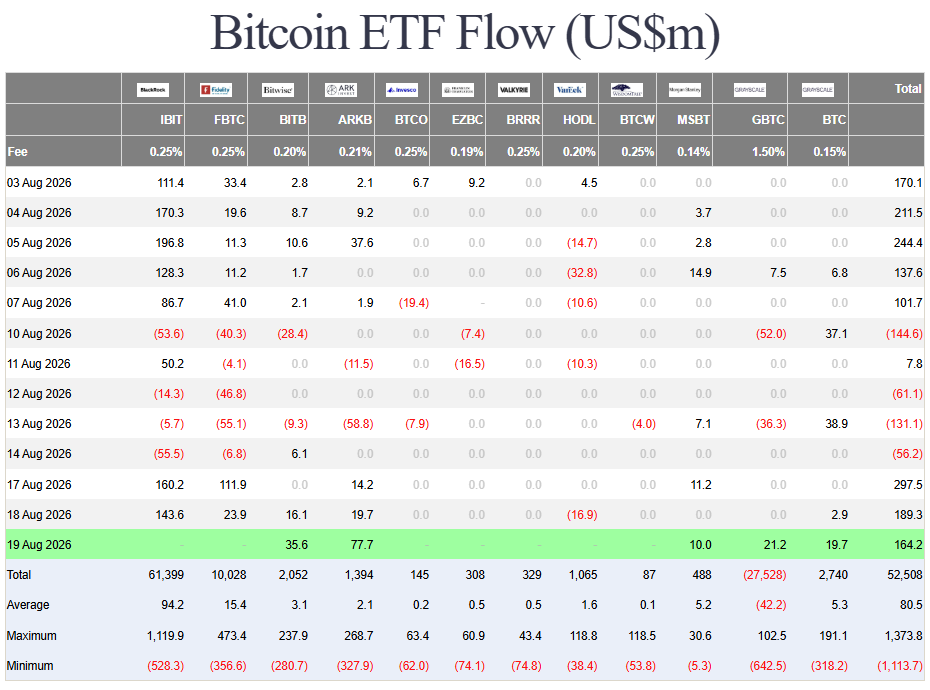
Source: Farside Investors
On the daily chart, the move also carried price back above its 200-day moving average on heavy volume, the kind of trend signal longer-term investors watch closely.
Bitcoin (BTC/USD) Four-Hour Technical Outlook
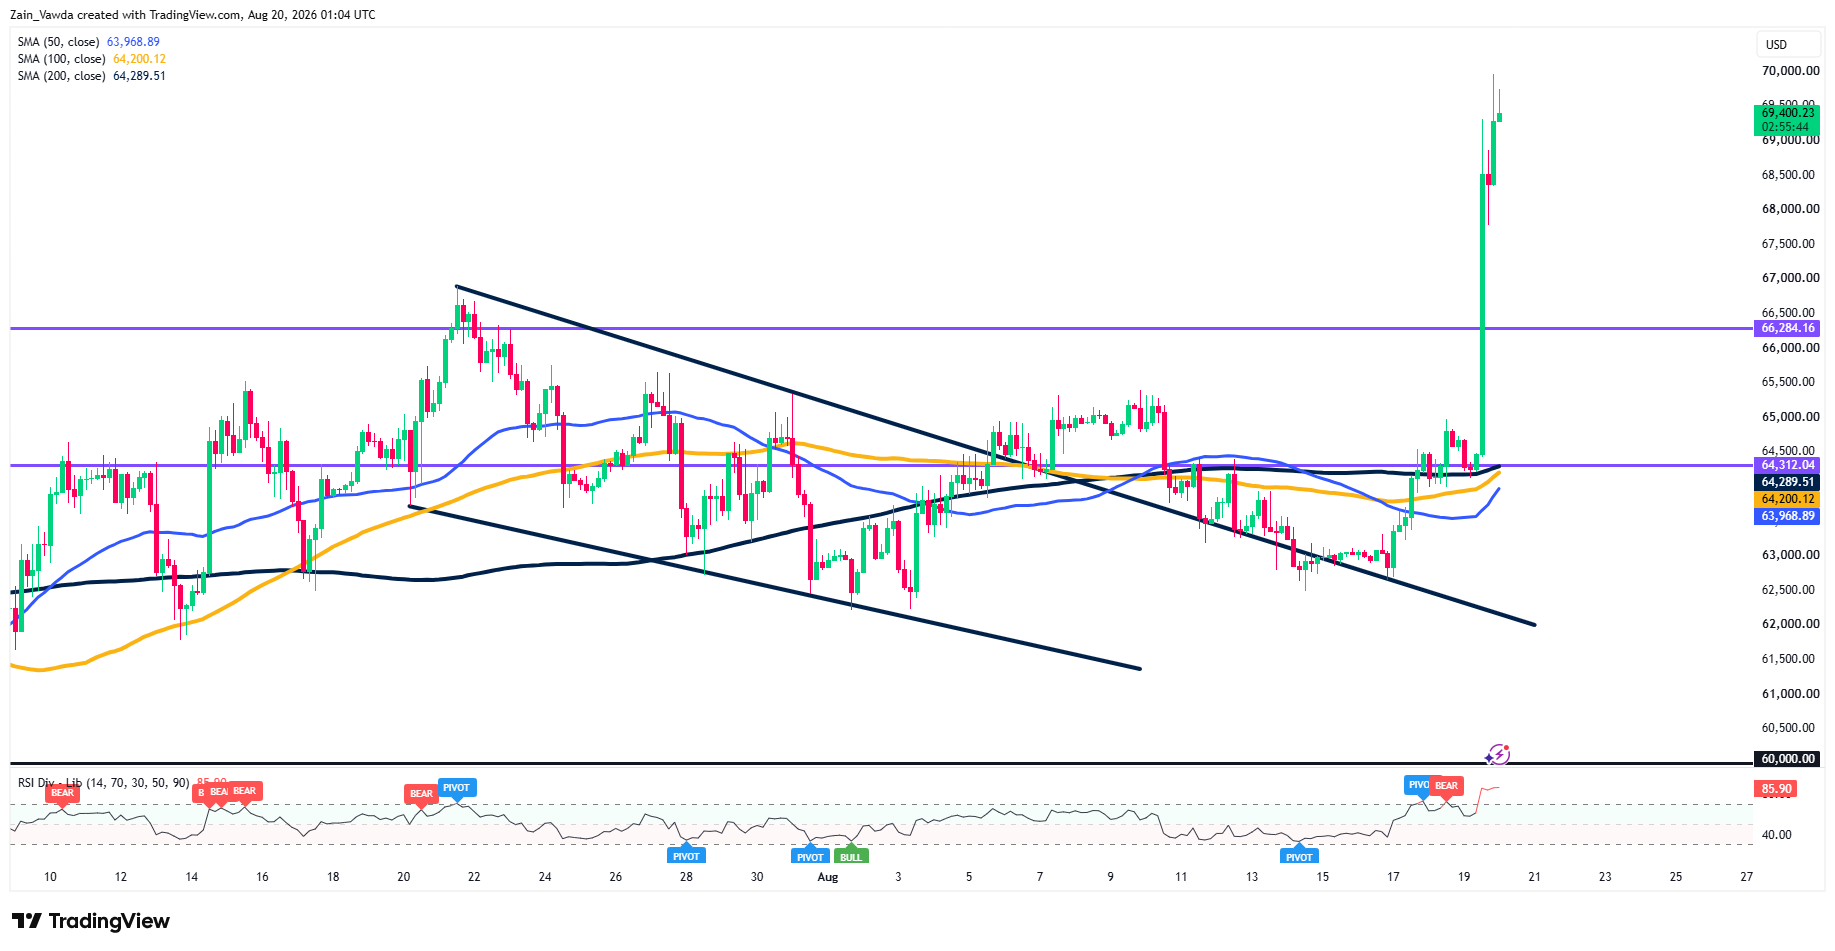
On the four-hour chart, BTC/USD trades near 69,400 after a near-vertical breakout that cleared weeks of range resistance in a single session.
Since mid-July price had coiled inside a tightening wedge, pinned around a tight moving-average cluster, the 50-, 100- and 200-period lines all bunched between 63,969 and 64,290.
Bitcoin Four-Hour Chart, August 20, 2026
Source: TradingView
Wednesday’s candle blew straight through both the 64,312 pivot and the 66,284 range high, leaving that whole zone as support far below.
The one caution is momentum: RSI at 85.90 is deeply overbought and already flashing bearish divergence, so a pause or pullback to retest 66,284 would be normal and healthy.
The trend stays up while price holds above 66,284; a break back below 64,300 would undo the breakout.
Where Price Could Head Next. Is a Move Above $70k Sustainable?
The immediate hurdle is a well-defined resistance confluence just overhead. The region between 70,283–70,531, the February low-week and low-day closes, where several trendlines converge appears to be the first major test; a weekly close above would strengthen the case that a larger low is in.
Beyond it, 71,402 (the 100% extension of July’s advance) is the trigger for the next leg, then the 74,434–76,159 zone. I
ndependent analyst Jason Pizzino frames it similarly: sustained trade above 71,000 keeps the bulls in control, while a close back under 67,000 would warn the breakout was false.
Net: 70,300–71,400 is the gate. Clear it on a closing basis and the recovery has real room; stall there while this overbought and a retest of the 66,284–65,400 breakout zone becomes the base case.


