
Bitcoin is trading at 66,777, up more than 2.3% on the day and testing 66,284 — the pivot that capped the June bounce.
Bitcoin cleared the 50-day MA at 63,087 before a brief period of consolidation preceded the current attempt ata breakout.
That timing caveat is intriguing. A wick through a pivot that has already rejected price once is not a breakout, and the daily candle still has most of a U.S. session to decide what it looks like.
Traders who are eyeing a bigger bullish play beyond this level are better served waiting for the close than for the touch.
What is actually driving the bid
The move is macro, not crypto-native. Mediators from Qatar, Egypt and Pakistan tabled a 10-day US-Iran ceasefire proposal overnight, pulling oil off Monday’s five-week high near $85 and shaving premium out of a September Fed hike — currently priced around 55%.
Every liquidity-sensitive asset repriced together: silver up nearly 5%, Nasdaq futures up 1.3%, gold up 1.4%, Ether up 4%. Bitcoin is simply the longest-duration instrument in that basket.
The implication for the level is uncomfortable. If the reason BTC is at 66,284 is a ceasefire headline that has not been agreed by either party, then the pivot is being tested on borrowed conviction.
Bloomberg Intelligence put a longer frame around that reading this week. Senior ETF analyst Eric Balchunas published a note on July 17, arguing that the 22-year history of the gold ETF is the closest available roadmap for Bitcoin ETF holders, on the grounds that both wrap a non-yielding store of value that generates no cash flow, leaving sentiment to set the price.
Bitcoin ETFs, he wrote, may be following the same script of “spectacular gains, painful drawdowns and recoveries that may test investors’ patience.” The detail the relay coverage has largely skipped is what that script actually contains: SPDR Gold Shares briefly overtook SPY as the world’s largest ETF in 2011, then spent roughly eight years stagnating against outflows before it recovered.
Bitcoin peaked above $126,000 in October 2025 and trades more than 50% below that today.
Bitcoin ETF Flows Turn Positive
For the week ended July 17, Spot Bitcoin ETFs logged their second consecutive week of net inflows, officially breaking a brutal two-month (eight-week) streak of outflows that had drained billions from the funds.
Spot Bitcoin ETFs saw approximately $75.6 million in net inflows for the week. While positive, analysts noted the volume is still modest compared to the roughly $8 billion that exited the funds over the prior two months.
The positive momentum was largely driven by BlackRock's iShares Bitcoin Trust (IBIT). On July 17 alone, IBIT pulled in over $136 million, masking weakness in other funds.
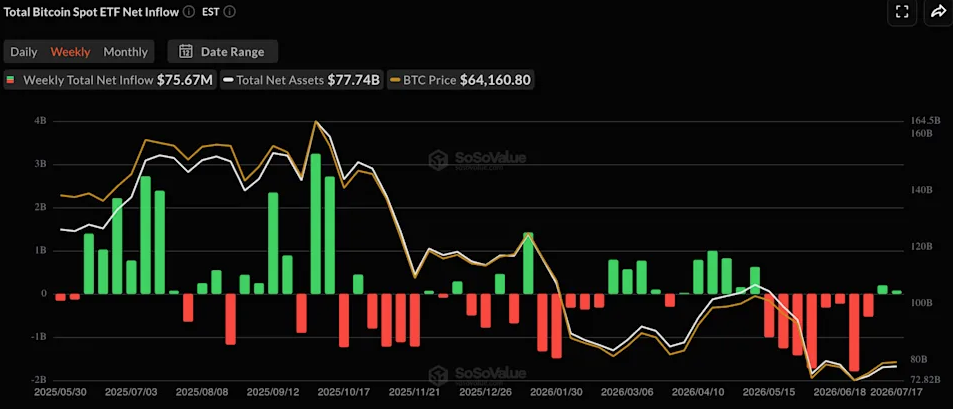
Source: SoSoValue, Yahoo Finance
Overall, the data suggests that institutional investors are cautiously re-engaging with Bitcoin ETFs, though a complete structural reversal will require more sustained, high-volume inflows.
Scenarios into the nearest catalyst
The binding catalyst is the ceasefire outcome, with the July 28-29 FOMC behind it and Fed officials already in blackout.
Tesla’s result on Wednesday carries a minor crypto read-through given its balance-sheet holding, but it is noise against the rate channel.
Bitcoin Daily Chart, July 21, 2026
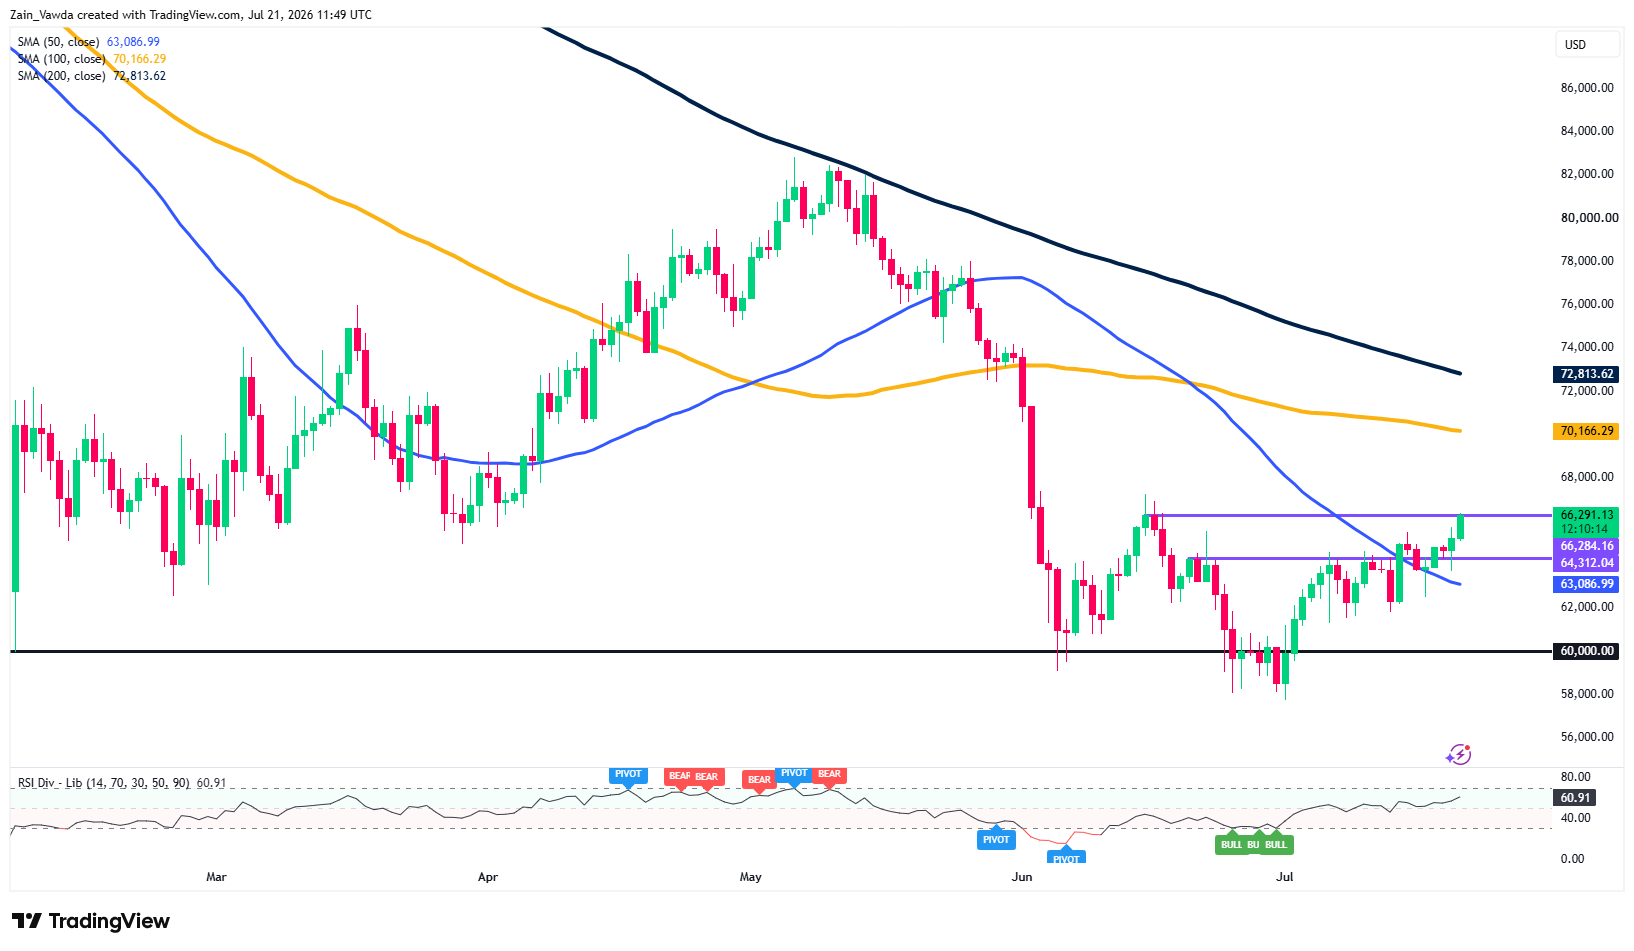
Source: TradingView
Bitcoin has pushed through 66,284 trading at 66,777, extending the recovery off the early-July low near 58,000 that was flagged by successive bullish RSI divergences.
The 50-day MA (63,097) has been reclaimed and is flattening, while 64,312 — former resistance — now becomes the first support on any retest.
Below that, 60,000 remains the structural line for the recovery.
Momentum backs the move: RSI at 62.49 is rising and well clear of the midline, with no bearish divergence yet.
The first test is a daily candle close above the swing high at 66,284.
The harder test sits overhead. The 100-day MA at 70,171 and 200-day at 72,816 both slope lower and cap the downtrend.
Until 70,171 gives way on a daily close, this stays a counter-trend bounce.


