Bitcoin is trading in the $63,400 area on Tuesday having reached a high of around $64,500 in the Asian session. Bitcoin has extended a recovery of roughly 6–7% over the past week from a low near $57,800, a 21-month trough hit in the final week of June.
The bounce is real, but so is the damage: BTC remains about 49% below its October 2025 all-time high of $126,210.
What's Driving the Bounce
Three forces converged.
First, the macro unlock: the July 2 payrolls miss (+57,000 vs. +110,000 expected) sharply reduced Fed rate-hike expectations, lowering the opportunity cost of holding non-yielding assets and handing Bitcoin its best week since March.
Second, mechanics: more than $450 million in short liquidations above $62,000 added forced buying to the move.
Third, flows: spot ETF inflows turned positive on Friday after 9 days of outflows.This was followed up by another day of gains on Monday, has the tide officially turned?
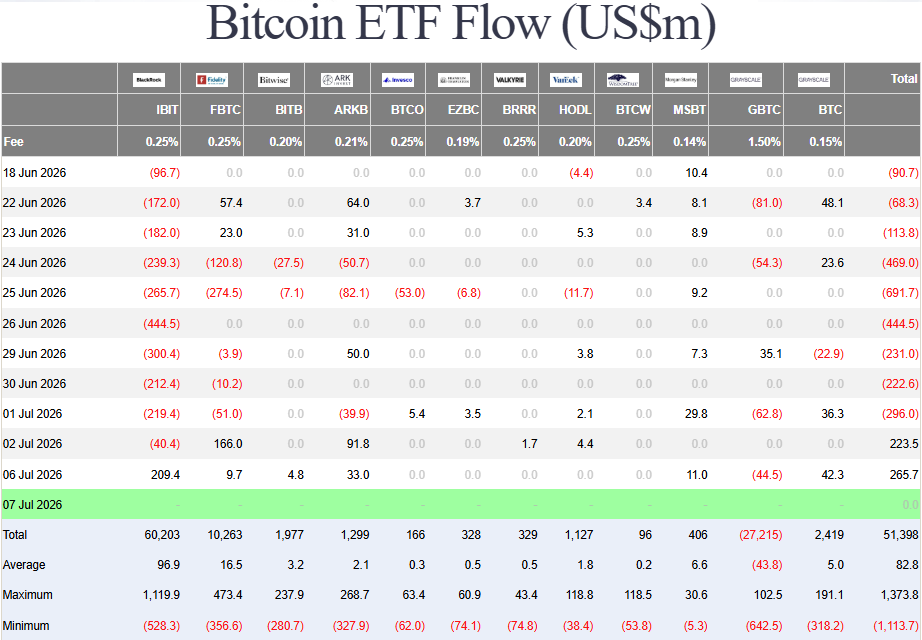
Source: Farside Investors
Sentiment remains depressed but improving, with the Fear & Greed Index at 28 (Fear), up around twelve points as price recovered from the $57,800 area.
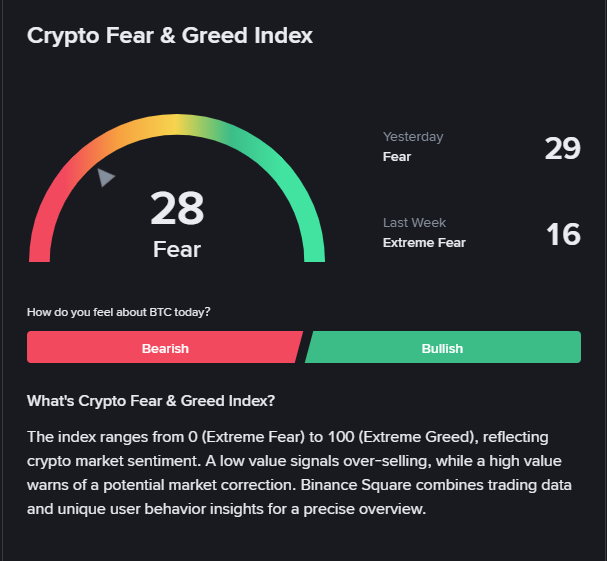
Source: Binance Square
One overhang persists: Strategy sold 3,588 BTC for roughly $216 million over the past two weeks to fund dividend obligations, its holdings now standing at 843,775 BTC. This has had an impact on sentiment but for now markets appear to be shrugging it off.
Short-Term Outlook: The Map for the Coming Days
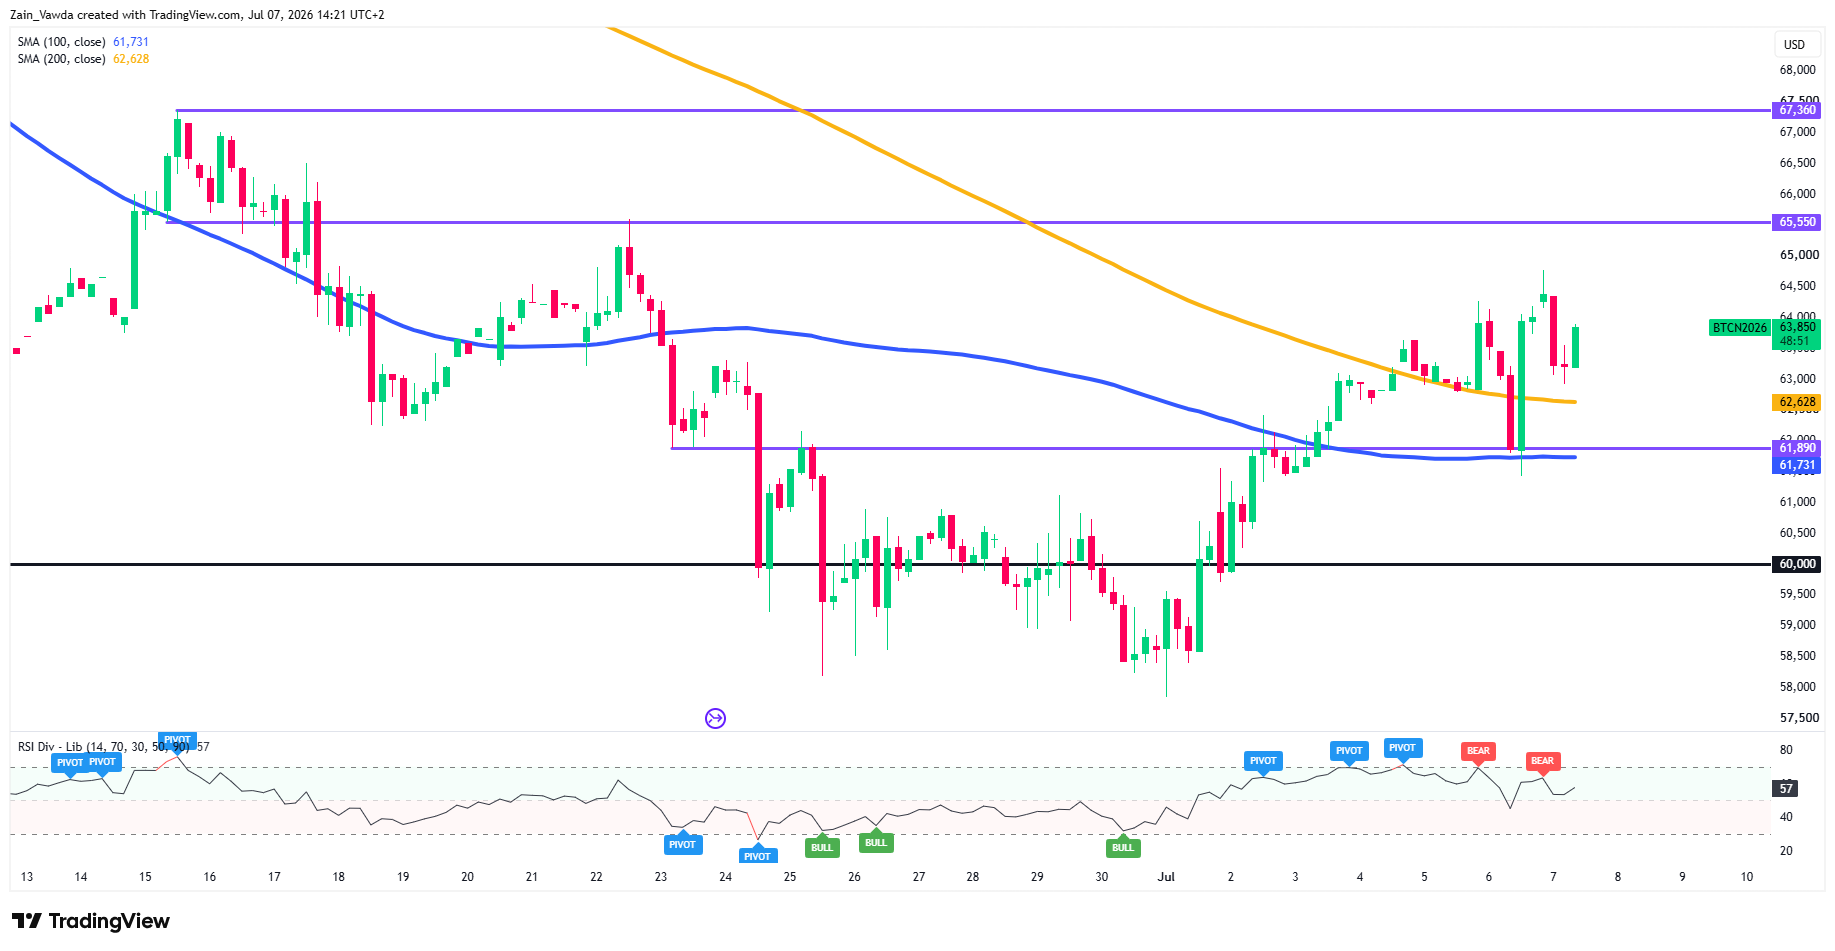
Bitcoin Futures (BTC1!) has posted a solid recovery, successfully breaking above both the 100 SMA (61,731) and 200 SMA (62,628) to shift the near-term bias back to the bulls.
The price is currently trading around 63,150, using the recently breached moving averages and the 61,890 horizontal level as immediate support.
If buyers maintain this momentum, the next major upside hurdles wait at 65,550 and 67,360.
Meanwhile, a strong psychological floor remains firmly established at 60,000. With the RSI holding in constructive territory at 57, the path of least resistance remains upward as long as the market stabilizes above the SMAs.
Bitcoin Four-Hour Chart, July 7, 2026
Source: TradingView
The catalysts are stacked and near: Wednesday's FOMC minutes (2:00 p.m. ET) is the first test.
A hawkish read on the June hike debate would hit BTC through the same real-yield channel punishing gold, while a dovish, energy-is-transitory tone extends the squeeze.
June CPI on July 14 is the bigger event; May's 4.2% headline was energy-driven, and with crude now in the high $60s, a soft print would compound the rate-relief trade.
The base case into those prints: choppy consolidation between $62,000 and $65,600, with the macro data, not crypto-native flows deciding which side breaks.


