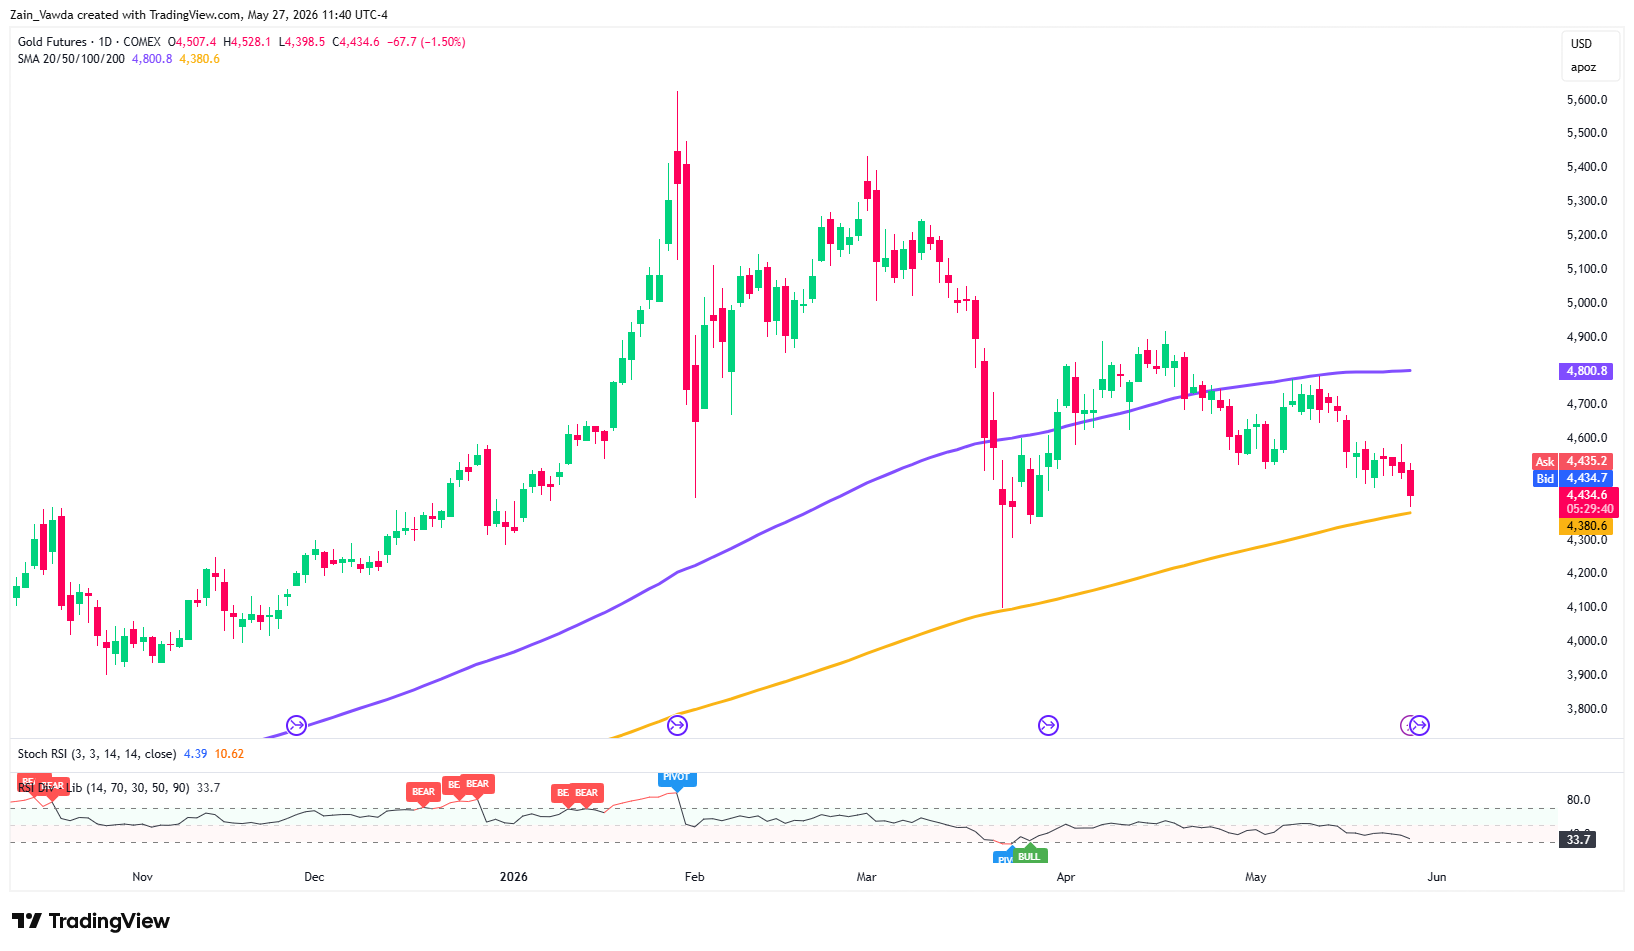
Gold is under renewed pressure today, trading near $4,400 per ounce, a level last seen two months ago. The precious metal has edged its way lower since the start of the week with Sunday's gap higher being closed before the precious metal saw renewed selling pressure.
Commitment of Traders (CoT) Report
The latest Commitments of Traders (COT) report data is from the release on Friday, May 22, 2026 which may in part explain Gold slide for the majority of the week thus far.
The macro picture shows a market juggling shifting monetary policy expectations and geopolitics, specifically, headlines around a potential US-Iran deal, which have triggered some near-term pullbacks in commodities and a stabilization in the dollar's recent run.
Institutional momentum around Gold has certainly slowed. Based on the data, Large Speculators (Non-Commercial Traders) saw net-long contracts drop to 159,833, down roughly 6.9% from the previous week's 171,600 contracts. While still heavily bullish, this drop indicates a noticeable reduction in conviction and light long-liquidation as the market moves into a near-term consolidation phase.
Looking at a more granular subset of the speculative category, Managed Money acts as the "hot money" most reactive to technical shifts and immediate macro news.
Reflecting a notable shift in institutional sentiment, managed money net-long positions fell by 6,239 contracts to a total of 94,388 contracts. This reduction in exposure marks the least bullish net stance for these hedge funds and trend-followers in three weeks, indicating that short-term traders are actively dialing back their upside bets amid the current macro environment.
The way Gold prices have struggled this week, there is a real chance that the shift above may have continued this week and will be reflected in the CoT report due on Friday May 29.
US-Iran Ceasefire Update
There have been brief spikes in the price of Gold today and this was largely due to Iranian state media announcing that the US and Iran have created a preliminary, unofficial plan to end their current conflict.
Under this draft agreement, the US military would leave Iran and end its naval blockade. In return, Iran would allow normal commercial shipping to resume through the critical Strait of Hormuz within a month. If the two countries can finalize this deal within 60 days, it will be officially locked in through a binding UN Security Council resolution.
This news caused the US Dollar to drop, erasing the gains it had made the day before. Investors are now waiting for a cabinet meeting later today, where US President Donald Trump is expected to discuss the situation and potentially provide updates on these high-stakes negotiations.
The Rate Hike Narrative Gathers Pace
The dominant force bearing down on gold right now is a sharp repricing of Federal Reserve expectations.
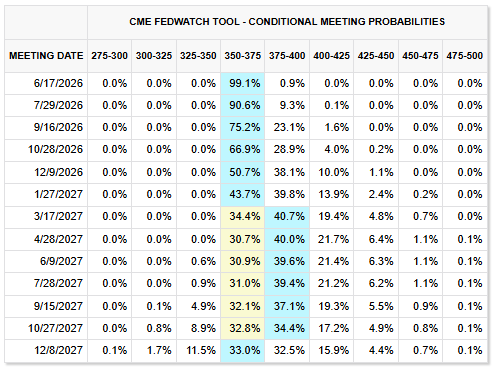
Source: CME FedWatch Tool
Over the last week, the hawkish shift in rate expectations have continued with markets now pricing in around a 50% chance of a rate hike by the end of 2026. The April FOMC minutes coupled with the ongoing rhetoric of Fed Policymakers around sticky inflation and high Oil prices has kept the needle moving.
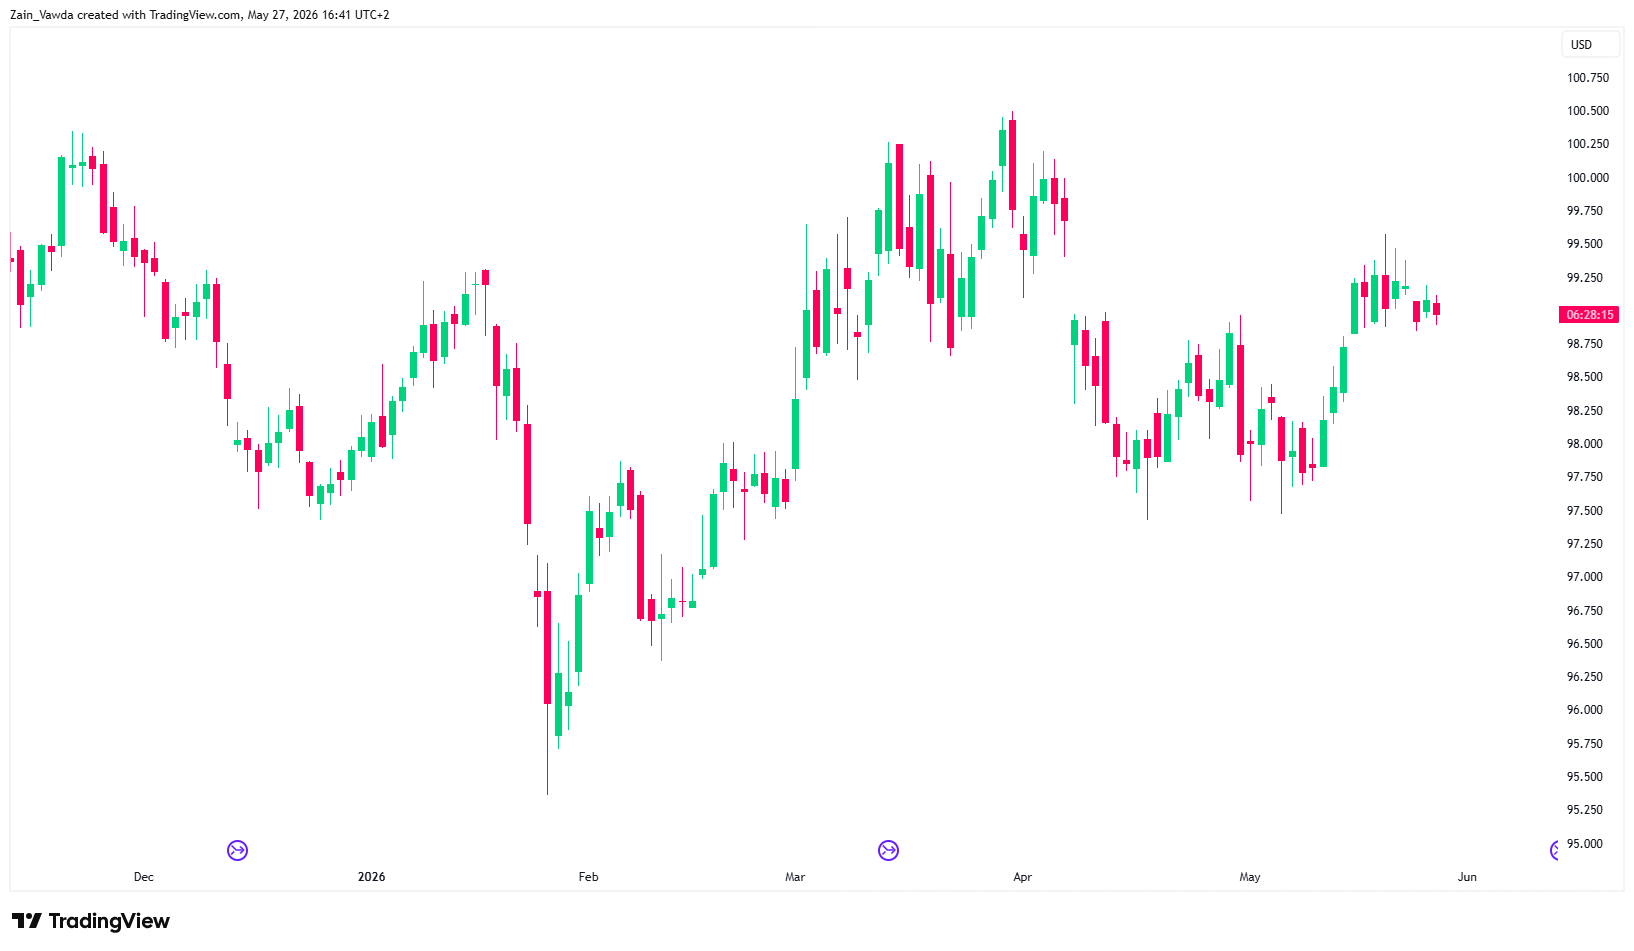
This move has supported the US Dollar with the US Dollar Index Futures (DX1!) breaking above a key resistance level around the 98.95 handle.
US Dollar Index Futures (DX1!) Daily Chart, May 27, 2026
Source: TradingView
Gold's drop to $4,400 is the product of a specific and identifiable chain of events: an Iran-driven oil shock, inflation that has re-ignited Fed rate hike expectations, hawkish signals from Fed policymakers, a crowded speculative long position in the COT data now being cleared, and a dollar that has reclaimed strength.
These factors have put the metal firmly on the defensive.
Where to Next for Gold Prices?
Scenario 1: Continued Decline — The $4,200 Test
If this week's GDP and PCE data come in hotter than expected, the hawkish Fed narrative will be further cemented. If gold breaks below the $4,200 level, the bullish structure would no longer be intact and could trigger short-term profit-taking.
A breach of that level combined with further COT long liquidation could see gold probe the $4,000 psychological floor.
Scenario 2: Stabilization and Base-Building Around $4,400
A sharp decline in oil prices over the past week has helped ease concerns about inflationary pressures and further interest rate hikes. If US-Iran ceasefire negotiations progress and oil retreats further, inflation fears could cool, allowing gold to consolidate here before its next directional move.
Gold Futures (GC1!) Daily Chart, May 27, 2026
Source: TradingView
Scenario 3: Recovery Toward $5,000+ — The Structural Bull Case
The longer-term case for gold remains intact. A 16% pullback from an all-time high ($5,597) , with inflation at 3.8%, 244 tonnes of central bank buying in a single quarter, and bar-and-coin demand at its second-highest quarterly level ever, is not a bear market it's a correction inside an ongoing structural bull market.
Goldman Sachs is holding its year-end 2026 gold price target at $5,400 per ounce. Their logic: the moment markets accept the Fed won't tighten enough to break this cycle, real yields compress and gold re-accelerates. UBS, meanwhile, has raised its gold price outlook, forecasting gold to reach $5,000 per ounce by Q3 2026, with a potential upside of $5,400 if US political or economic risks intensify citing sustained support from low real yields, rising fiscal risks, geopolitical uncertainty, and strong demand from central banks and ETFs.


