The session in one line. Oil did the damage.
A fresh surge in crude, Brent briefly over $108, WTI settling above $102 reignited inflation fears, drove Treasury yields to their highest since 2023, and pushed traders to bet harder on a Fed rate hike next week.
Stocks fell for a fourth straight day, the longest losing streak since June, and the rate-sensitive corners small caps, chips and gold took the most pain.
Equities: A Fourth Down Day, Led Lower by Rate-Sensitive Names
The S&P 500 closed down 0.58% at 7,591.70, the Dow lost 316 points (−0.60%) to 52,064.10, and the Nasdaq Composite fell 0.65% to 26,081.72 — a fourth straight session of declines, the S&P's worst run since June. Small caps were hit hardest again, with the Russell 2000 off about 1%. Technology and materials led the drop (both down more than 1%), and only communication services and consumer staples managed to rise. High-beta chip leaders bore the brunt — Intel fell about 3% and Micron about 2% — as traders worried that higher rates and dearer oil could slow the economy. As Capital.com's Kyle Rodda put it, the oil move kept a lid on Wall Street while the US-Iran escalation raised the risk of a longer, deeper conflict. For the week, the Dow is down about 2.5% and the S&P and Nasdaq about 1.6% each.
Rates: Yields at Multi-Year Highs, and the Treasury's Buyback Fell Flat
The 10-year Treasury yield spiked to roughly 4.95%, its highest since 2023, and up almost a full percentage point since the Iran war began, before easing back toward 4.85% by the close.
The long end stayed heavy even after the Treasury bought back $5.19 billion of longer-dated debt, less than the up-to-$6 billion it had outlined.
The smaller-than-hoped operation did nothing to calm the market, a sign traders see this sell-off as an inflation-and-supply problem, not a plumbing one.
Commodities: Crude is the Story, Gold Caught by Real Yields
WTI jumped 6.7% to settle at $102.48, its highest since May 19 and Brent rose 6.3% to $107.63 after briefly topping $108.
Oil is now up more than 18% in September as the market prices in a longer war: the US has destroyed at least eight Iranian tankers since Saturday, and Houthi strikes hit Saudi energy facilities.
Goldman's Daan Struyven warned the risk of Brent above $120 is rising as shipping attacks intensify.
Gold couldn't stand up to the rate move, rising real yields and a firmer dollar outweighed the Middle East safe-haven bid, leaving bullion lower on the session (roughly the low-$4,300s to $4,400 area, depending on source). Silver held near $67, close to multi-decade highs.
Dollar: Firmer as the Hike Bet Builds
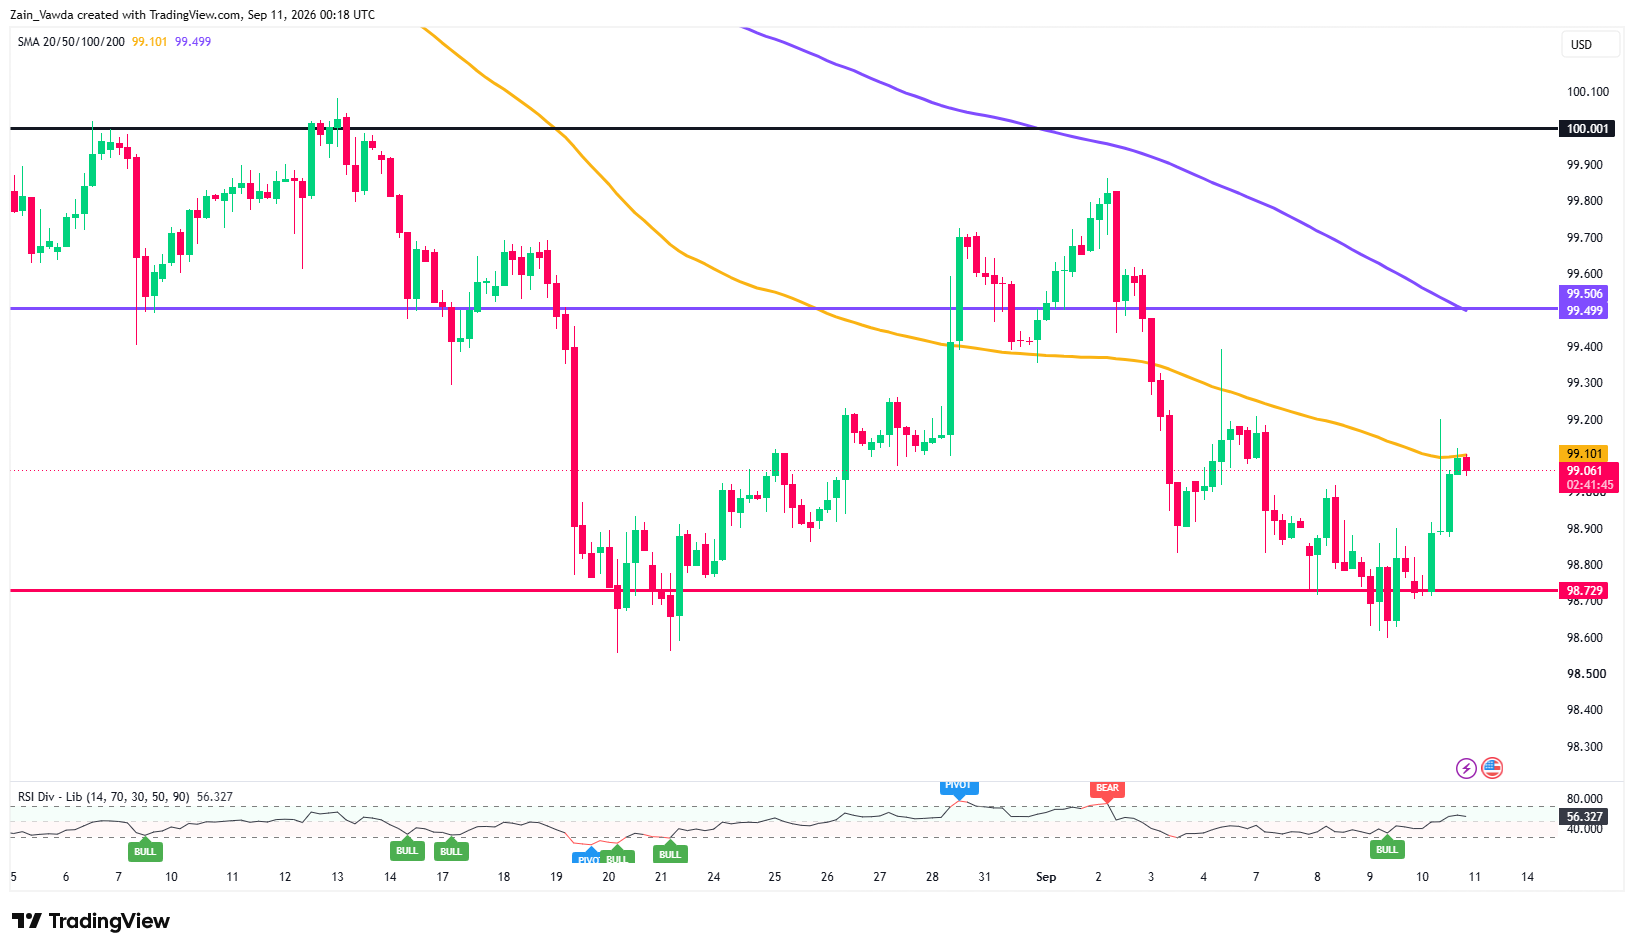
The dollar turned higher, with the Dollar Index adding about 0.3% to close near 99.1, as the producer-price data and climbing yields pulled buyers back in.
US Dollar Index (DXY) Four-Hour Chart, September 10, 2026
Source: TradingView
That is a shift from earlier in the week: the euro sold the fact of the ECB's own rate hike, and the greenback's yield advantage did the rest. Fed funds futures now price roughly a 70% chance of a hike on 16 September, with an increase fully priced by October.
Where S&P and Dow Jones Finished (H1)
Both index futures closed below their H1 moving averages and near session lows before a small late bounce.
The S&P (ES) settled around 7,600, under its 100- and 200-period averages (7,681 / 7,686) and sitting right on its session VWAP (7,601) after basing near 7,580.
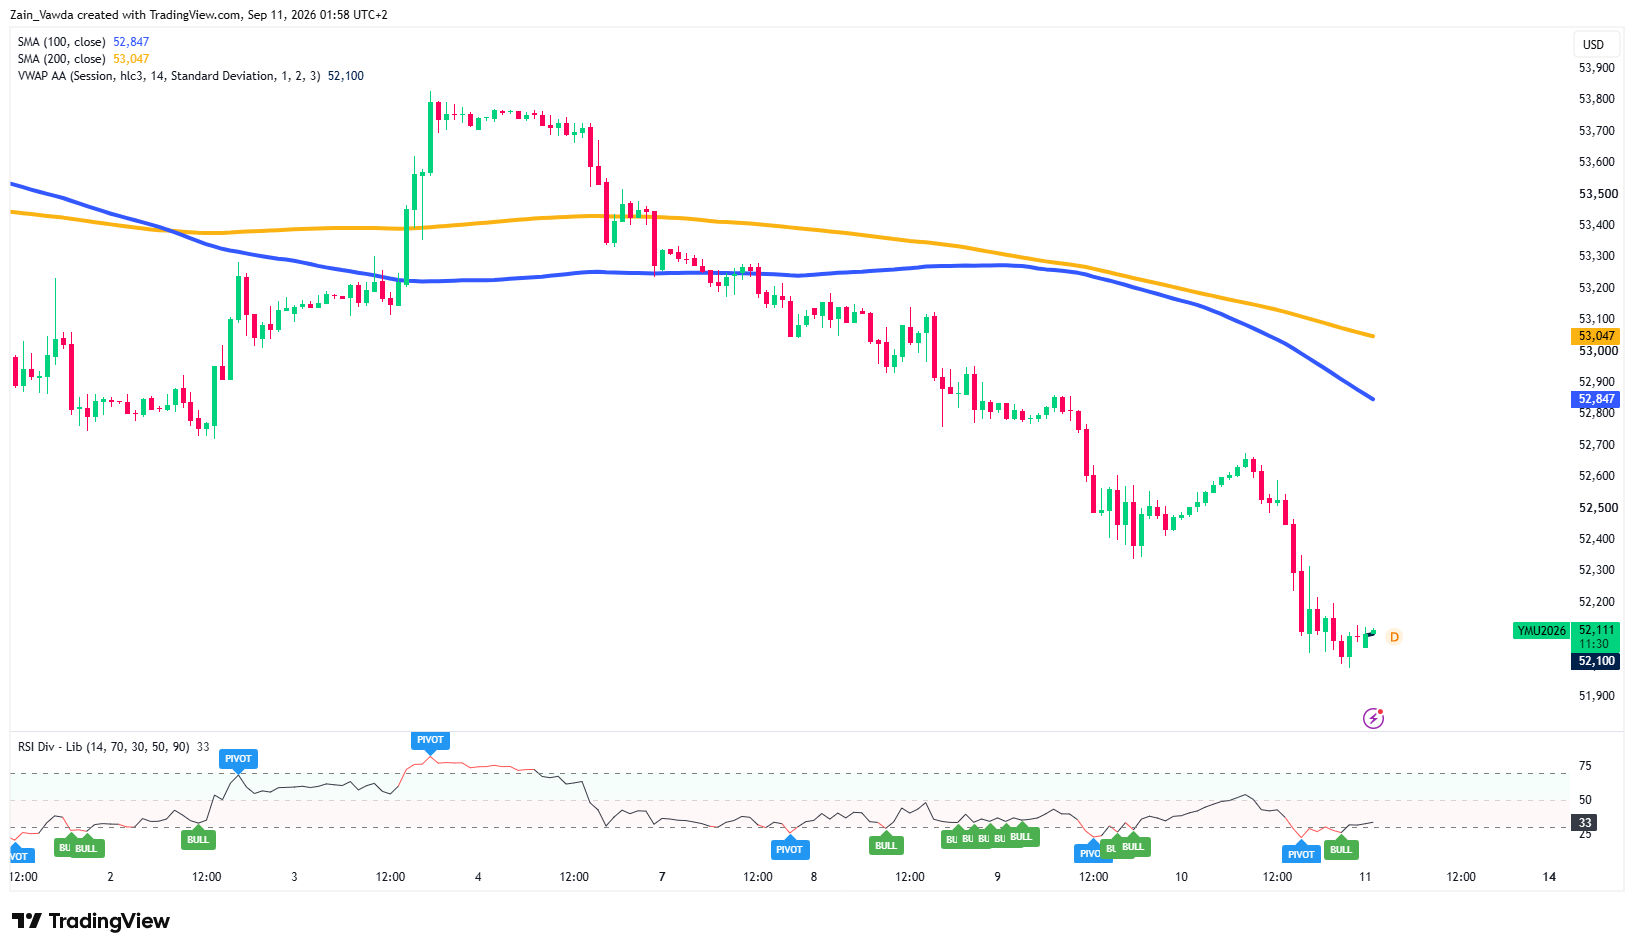
YM is the weaker chart: a clean multi-day downtrend from the 4 September high (~53,850) left it near 52,100, well below its H4 moving averages (52,847 / 53,047) and on its VWAP after a dip to ~51,950.
Dow Jones (YM) One-Hour Chart, September 10, 2026
Source: TradingView
Momentum (RSI in the low-to-mid 30s on both) is oversold and trying to turn, but with price below every average the bounce is corrective until the bulls reclaim those lines.
All attention now turns to the nearest catalyst which is the U.S. CPI release tomorrow.
It is the last major read before the Fed decides on 15–16 September, and some officials have said the call may hinge on this week's data. After the bell, futures were little changed with S&P futures a touch higher, Dow futures barely lower, as traders squared up ahead of the number.