The Tape At Midday
U.S. stocks are lower again at midday, with the same two culprits doing the damage: rising bond yields and rising oil.
The Dow is off about 411 points (0.8%), the S&P 500 is down 0.5% and the Nasdaq has shed 0.5%, a second straight down day after the Dow's worst session in almost three weeks on Tuesday.
The trigger was the bond market. The U.S. Treasury said it will triple its buyback of longer-dated government debt to $6 billion, a move meant to hold yields down.
Yet yields rose anyway, because parts of Wall Street had hoped for an even bigger number (Peter Boockvar noted some looked for $7–8 billion). The 10-year Treasury yield climbed to 4.857%, its highest since November 2023.
On top of that, oil kept climbing on the U.S.–Iran conflict: Brent pushed above $101 for the first time since July and WTI traded above $96, both up around 3%.
Under The Surface: Weak Breadth, One Big Offset
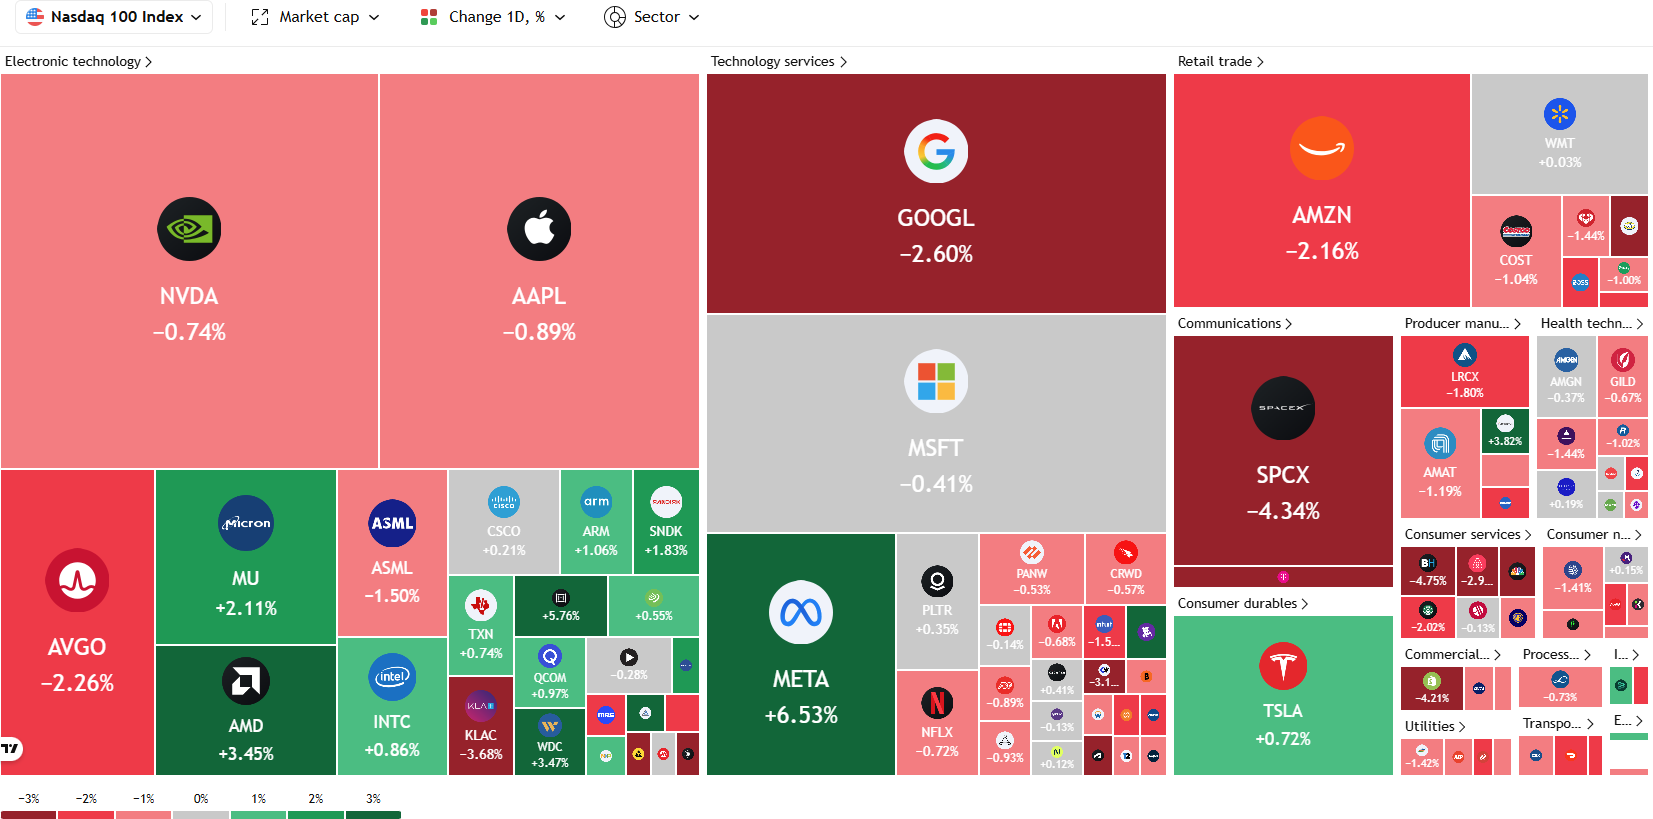
The heatmap tells a more fragile story than the index numbers. Most of the Nasdaq 100 is red, Alphabet is down 2.6%, Amazon 2.2%, Broadcom 2.3%, and SpaceX 4.3%. Chips are split (AMD and Micron higher, KLAC and ASML lower), and Nvidia and Apple are only modestly lower on Apple's own event day.
Nasdaq 100 Heatmap
Source: TradingView
What is holding the whole index up is a single name: Meta, up around 6% on a well-received product launch. Strip that one stock out and the Nasdaq's decline would look a good deal worse.
For an index trader, that is the key point, breadth is weaker than the headline, and one heavyweight is masking it.
That tension is what has strategists cautious. Globalt's Thomas Martin notes the market has held up without a real correction all year, but warns that stretched equity optimism and stretched rate-hike fears cannot sit together for long.
RBC's Lori Calvasina goes further, saying the risk of an ordinary 5–10% pullback has grown, pointing to weak September seasonality, looming midterm elections, the unresolved Iran war, and lingering worry about inflation and the Fed. Martin adds that oil near $120 would really get the market's attention.
Nasdaq (NQ) Technical Picture: H1 and M15
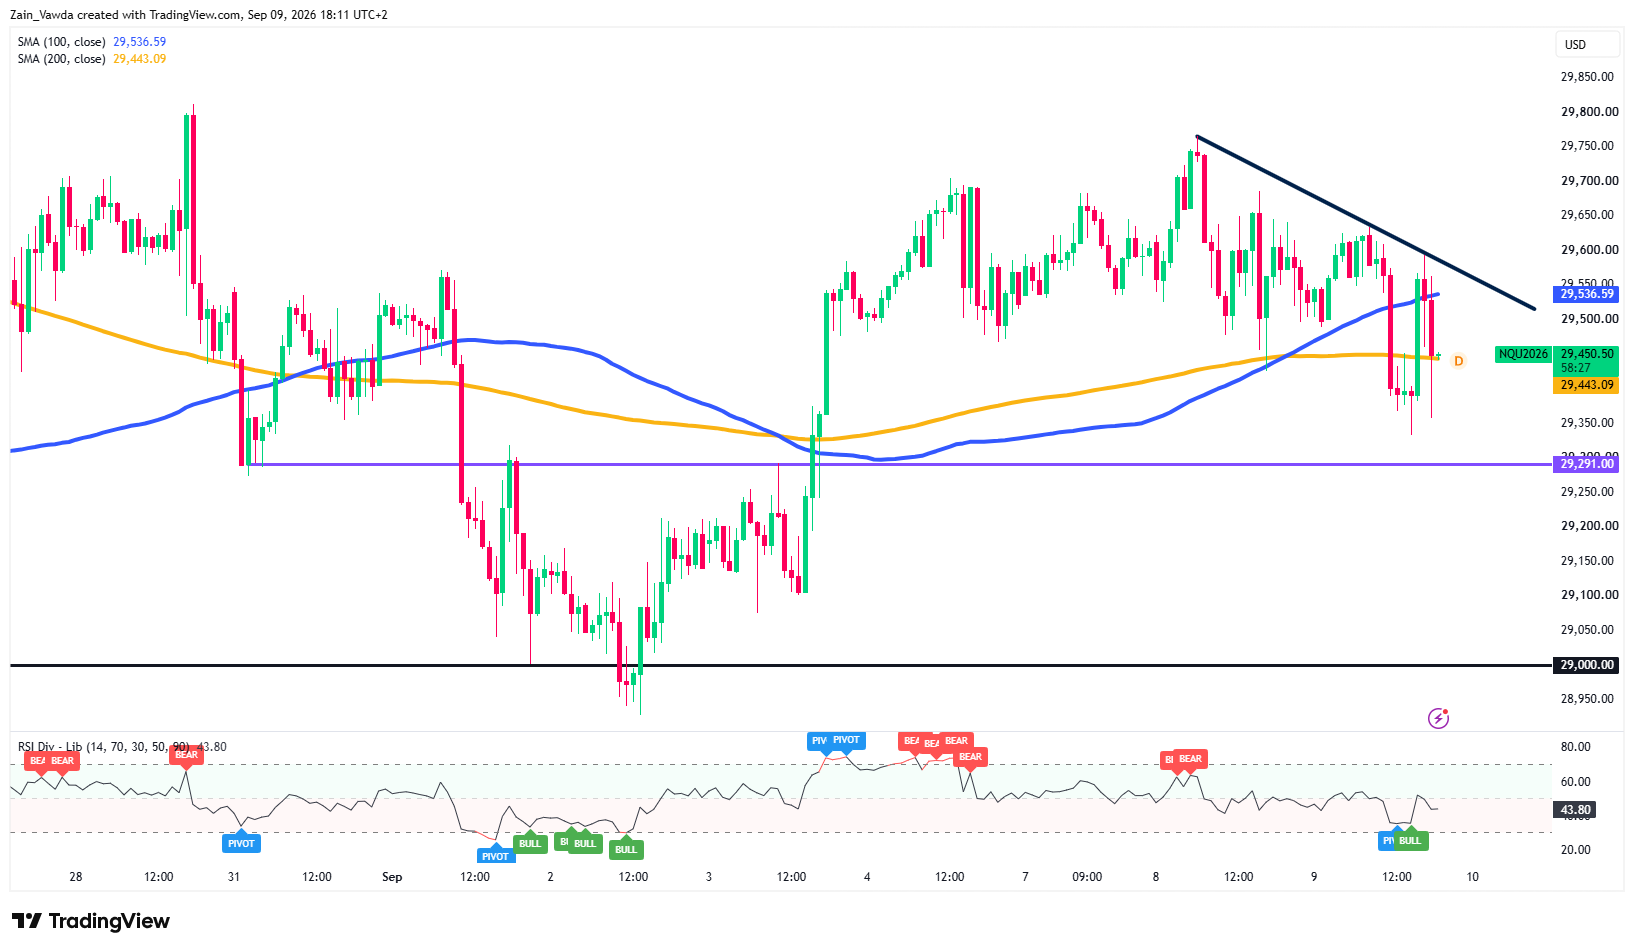
On the hourly (H1) chart, NQ is pinned on its 200-hour moving average near 29,443, the intraday line in the sand. (A moving average smooths recent prices to show the trend.)
Above price sits the 100-hour average around 29,536 and a falling trendline drawn off Monday's lower highs near 29,560; that band is the ceiling that has to break to end the short-term downtrend. Momentum (the RSI) is soft at 43.8.
Below, the first real support is the 29,291 shelf, just above the desk's long-running 29,264.75 pivot then the big 29,000 round number.
Nasdaq (NQ) One-Hour Chart, September 9, 2026
Source: TradingView
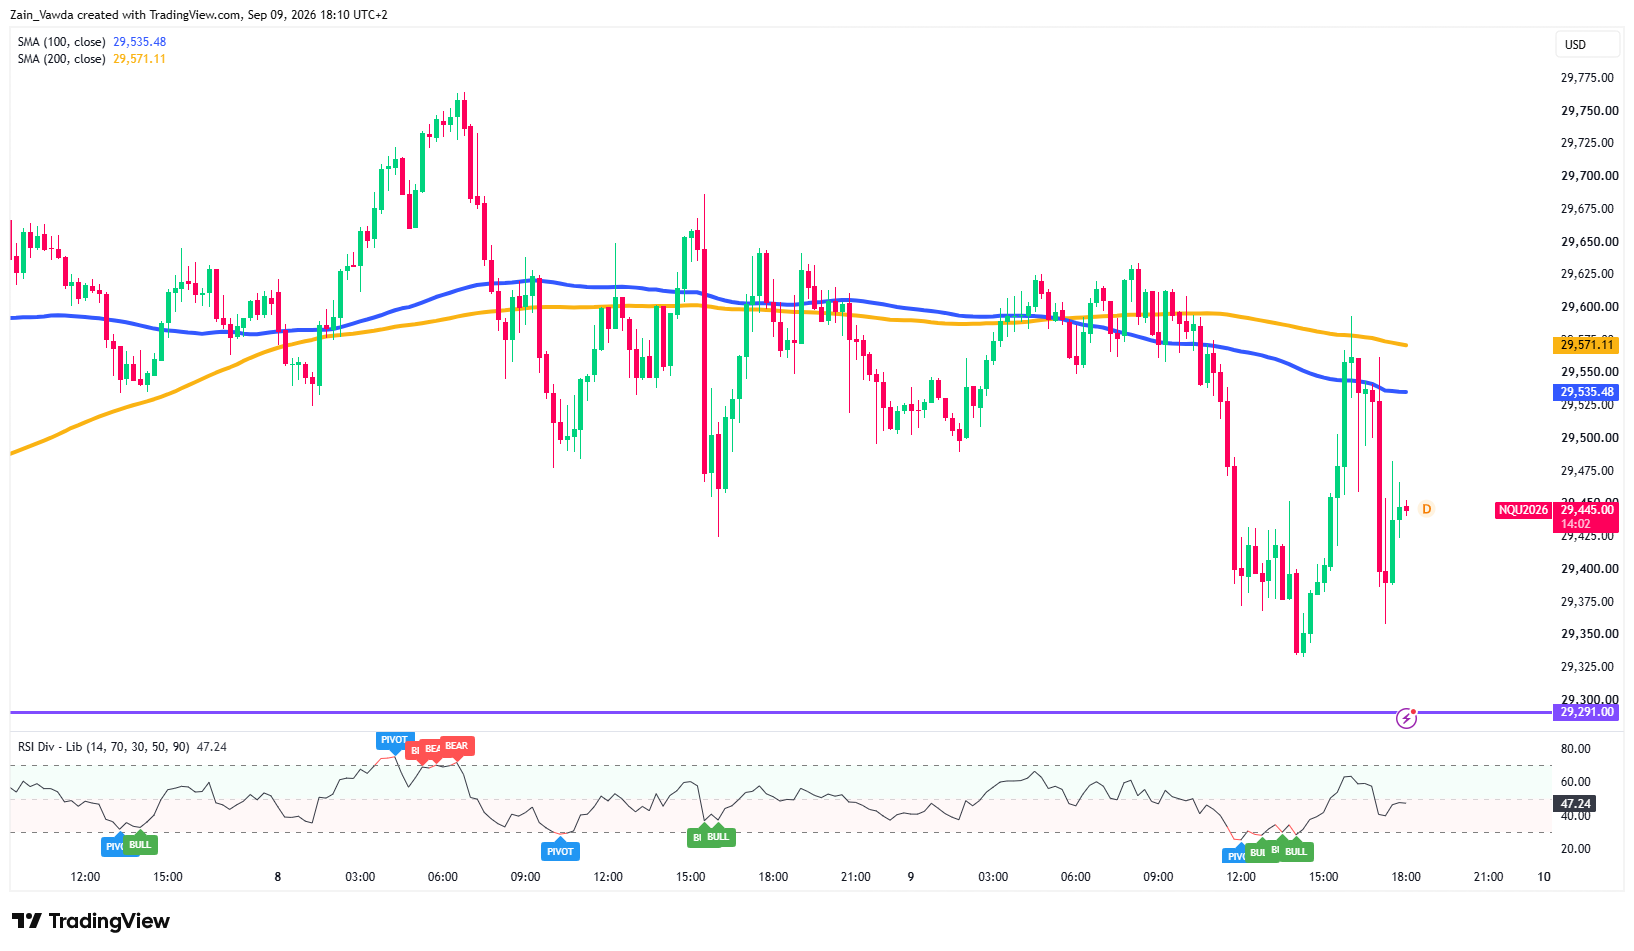
Zooming into the 15-minute (M15) chart, price is stuck below a wall of averages at 29,535–29,571 and has been making lower highs, with RSI around 47. It is bouncing inside a downtrend off an intraday low near 29,325–29,375. In plain terms: rallies are being sold into that average wall, and only a clean break above it flips the short-term tone.
Nasdaq (NQ) M15 Chart, September 9, 2026
Source: TradingView
Trader Positioning Data
A tape like this, weak breadth, a two-way chop around a key average, a binary CPI two days out is where over-trading hurts most.
Looking at the Positioning Edge Tool Data on MarketFramework, the cohorts are split the way you want to see for a short bias.
Profitable traders sit 38% long / 62% short, while unprofitable traders are 58% long, a 20-point gap the wrong way for the crowd, flagged as an extreme bearish divergence.
The winners are leaning short from an average entry of 29,429.7; the losers are long from 29,370.3 and underwater.
With price at 29,400, the smart money is fading into strength, supporting the sell-the-rally lean into your 29,535–29,571 wall.


