
The S&P 500's march to fresh record highs has been fueled by the optimism surrounding artificial intelligence (AI), resilient corporate earnings, and a Federal Reserve that appears closer to the end of its tightening cycle than the beginning of a new one. Yet some of the most encouraging signs for equity bulls may not be coming from the index itself.
Instead, they are emerging beneath the surface of the market, where participation has broadened significantly in recent months.
A Healthier Rally Emerges
One of the defining criticisms of the current bull market has been its dependence on a relatively small group of mega-cap technology stocks. For much of the past two years, investors questioned whether gains in the major indices accurately reflected the health of the broader market.
Recent breadth data suggest that concern may be fading.
According to LPL Financial, approximately 75% of S&P 500 constituents were trading above their 200-day moving averages as of Aug. 14, up nearly 20 percentage points over the previous three months. The improvement indicates that a growing share of stocks are participating in the advance rather than merely following the lead of a handful of market heavyweights.
Source: LPL Financial
For technical analysts, this matters because breadth often serves as a measure of the market's internal strength. When more stocks are advancing alongside the benchmark, rallies tend to be viewed as healthier and potentially more sustainable.
What History Says
The historical record offers additional support for the bullish case.
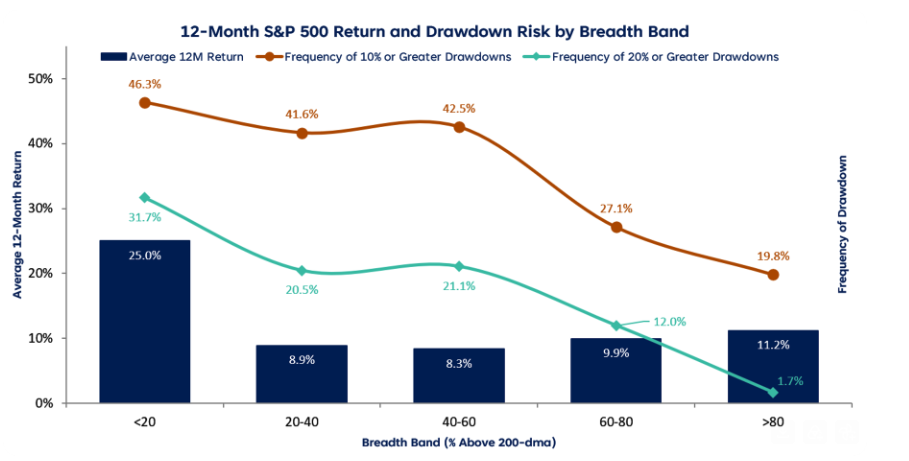
Since 1990, periods when between 60% and 80% of S&P 500 stocks traded above their 200-day moving averages have been associated with average 12-month forward returns of nearly 10%. Positive returns followed more than 80% of the time.
The statistics become even more compelling when breadth exceeds 80%, a threshold that has historically coincided with stronger returns and a lower probability of significant drawdowns.
In other words, broad participation has often been less about predicting the next few weeks and more about confirming that a larger trend remains intact.
More Than a Mega-Cap Story
The recent expansion in breadth is particularly notable because it suggests leadership is widening beyond the technology sector.
Industrials, financials, consumer discretionary names, and select cyclical sectors have increasingly contributed to the market's gains. That broadening participation has helped reduce concerns that the rally rests on a narrow foundation.
For investors, this shift may be especially important as markets enter a period that includes key economic reports, earnings releases, and Federal Reserve communications. A market supported by multiple sectors tends to be more resilient than one dependent on a single theme.
Why Breadth Isn't a Crystal Ball
Adam Turnquist, Chief Technical Strategist at LPL Financial, cautions that breadth should not be viewed as a standalone forecasting tool.
Even strong breadth environments can experience corrections, periods of consolidation, or bouts of heightened volatility. Markets rarely move in a straight line, particularly when valuations are elevated and investors are closely watching economic data for signs of slowing growth.
Rather, breadth's greatest value lies in confirming trend quality. When major indices reach new highs and are accompanied by expanding participation, the signal is generally viewed as more constructive than when gains are concentrated in a shrinking number of stocks.
That distinction is particularly relevant today as investors debate whether the market's advance can continue after an extended run higher.
What Could Change the Picture
A few developments would undercut this bullish breadth narrative worth watching for:
- A share reversal in the 200-day MA reading back to 50%-60%, or lower, would suggest the broadening was temporary, rather than structural.
- Equal-weight underperformance resuming: If the Invesco S&P 500 Equal Weight ETF (RSP) starts lagging the State Street SPDR S&P 500 ETF Trust (SPY), it would indicate capital rotating back into concentrated megacap leadership.
- Earnings growth outside mega-caps disappointing: Broader participation in price gains needs to be eventually justified by broad participation in earnings growth. Else, the rally risks being a valuation story, rather than a fundamental story.
The Bigger Picture
The current backdrop does not eliminate risks. Investors still face uncertainty surrounding economic growth, inflation, interest rates, and geopolitics. Earnings expectations remain elevated, leaving little room for disappointment.
Yet beneath those concerns, market internals continue to improve. For now, one of the market's strongest bullish signals may not be the record highs making headlines, but the growing number of stocks quietly joining the move.


