
US equities are grinding through the busiest stretch of Q2 season with a deceptively calm index tape — but underneath it, the reaction function has turned unusually punishing. The defining feature of this quarter is not the growth rate; it is that Wall Street raised the bar going into it.
Wall Street is betting on a strong earnings tailwind, with S&P 500 profits seen rising 25% in 2026 and 16% in 2027. Small caps could do even better, with growth of 39% this year and 43% next year.
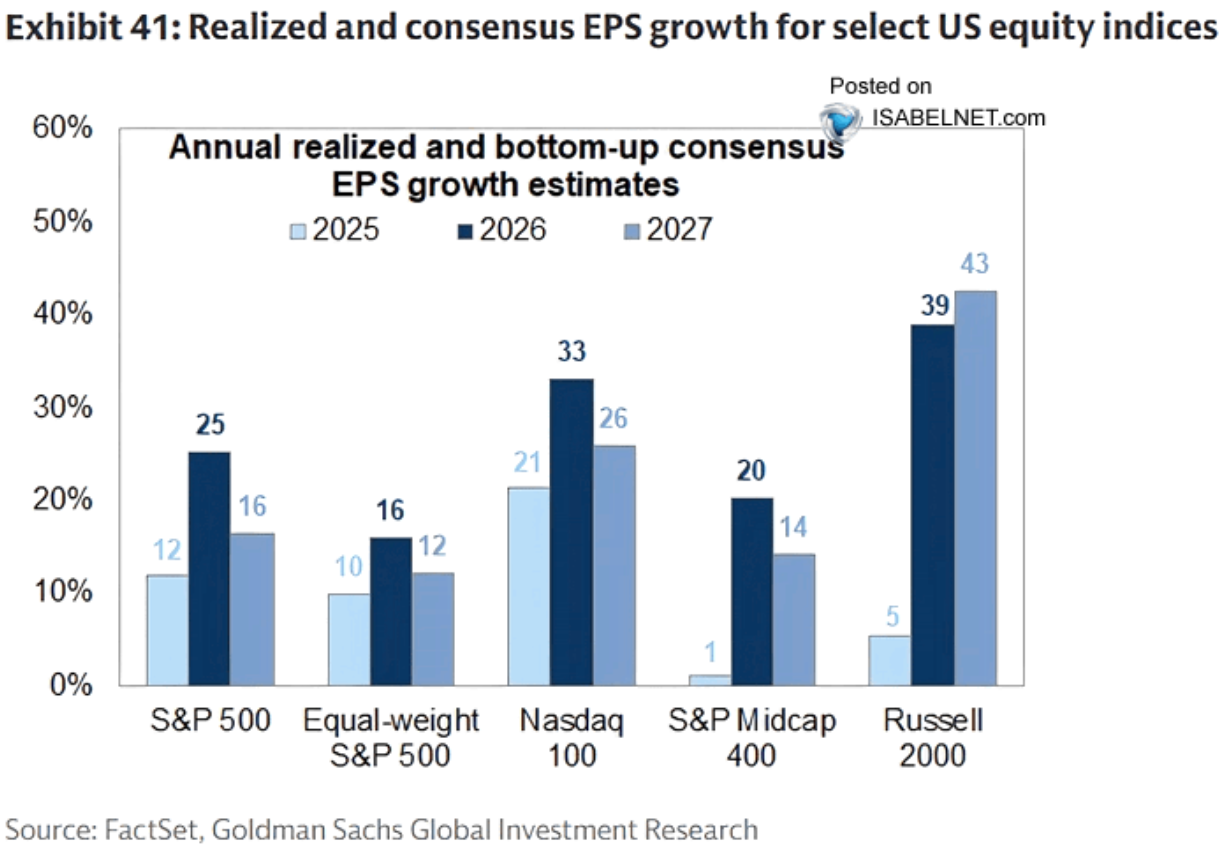
Source: Isabelnet, Goldman Sachs
For an ES trader, that reframes the risk entirely: the danger is not broad drift, it is concentrated air-pockets on names that miss a number that was already lifted — and tonight’s Alphabet and Tesla prints sit directly on top of that fault line.
The Bar Moved the Wrong Way
In a normal quarter, analysts trim estimates by 2–4% as reality sets in, handing companies an easier number to clear. Q2 2026 did the opposite: S&P 500 EPS estimates were revised up about 3.4% during the quarter, against a typical ~4% cut over the past two decades. Consensus year-on-year growth sits near 23.6% — a second straight 20%-plus quarter.
Bullish on its face, but it means the whisper number is elevated and the margin for error has thinned. Roughly half the projected growth is tied to AI-infrastructure spend, concentrating the season’s outcome in a handful of megacaps and semis.
Even the Beats are Getting Punished
The FactSet data is the tell. With about 10% of the S&P 500 reported, 88% have beaten EPS — well above the 78% five-year average — and the magnitude of those beats is running 16.4% above estimates versus a ~7% norm. Yet the market is punishing both positive and negative surprises more than usual: misses have dropped an average of 4.2% against a historical 2.9%.
With the forward P/E running above its 10-year average, good is not good enough — beats need to be bigger to be rewarded, and stumbles are dealt with harshly.
Why this Lands on the S&P 500
Here is the trap for index traders: the punishment is playing out at the single-name level while ES itself grinds in a range. A contained VIX near 17 understates the realized volatility churning inside the tape. Layer on thin July liquidity — a report that gaps 5% in October can move 10–15% in summer — and you get a benchmark that looks quiet right up until a concentrated megacap gap drags it.
Tonight is that concentration event: Alphabet and Tesla, the first two of the Magnificent Seven, both after the close, with capex and AI-ROI commentary the swing variable. The ES risk into Thursday’s open is not the drift; it is the gap.
Scenario matrix — anchored to tonight’s Alphabet & Tesla (after close)
| Case | Earnings Trigger | S&P 500 |
|---|---|---|
| Bull | Both clear the raised bar; capex framed as disciplined ROI | Single-name relief lifts the megacap complex; ES breaks 7,600 and targets 7,630. |
| Base | Mixed prints / in-line capex commentary | Range holds 7,480–7,600; dispersion stays trapped at the single-name level, index drifts. |
| Bear | A miss or capex shock on either name | Gap risk dominates; 7,465–7,480 shelf fails, 7,430 then 7,353 in play into Thursday. |
Looking at the S&P 500 one-hour chart, price has rallied off the July 21 low near 7,470 to 7,558.75, driving straight into the 200-MA (7,559.79) — the exact level that capped the tape through mid-July. This is the decisive test.
S&P 500 One-Hour Chart, July 22, 2026
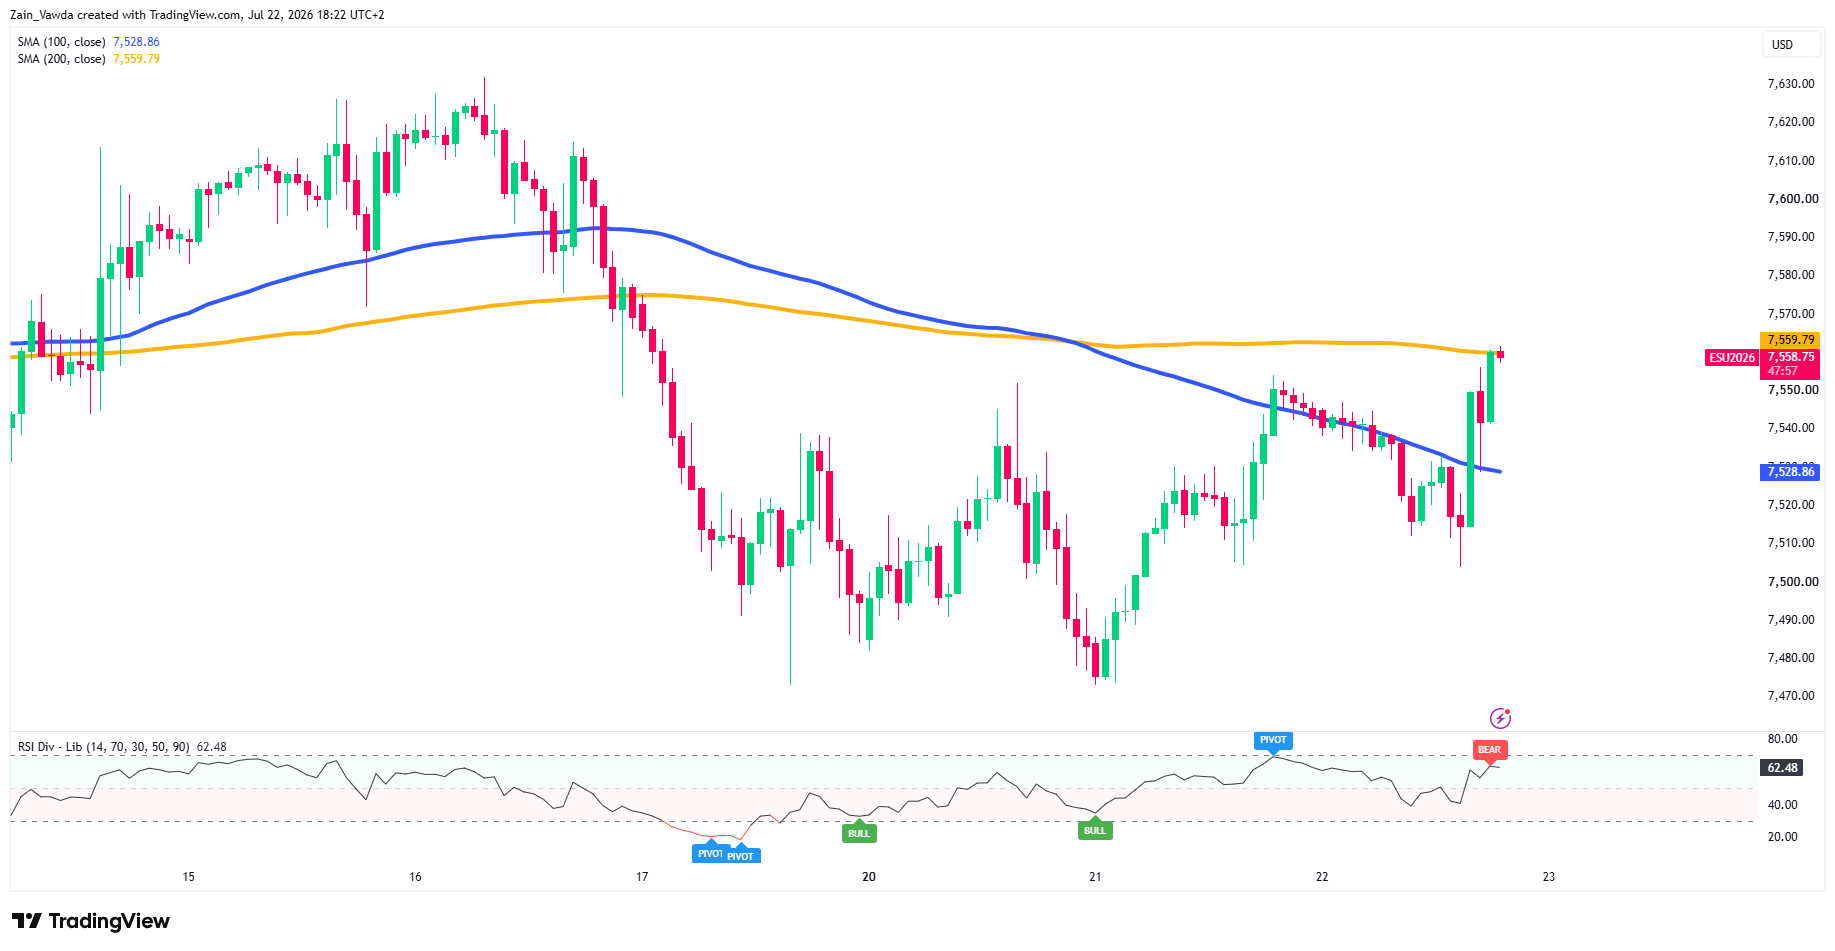
Source: TradingView
The 100-SMA (7,528.86) has been reclaimed from below and now provides first support on any pullback, aligning with the broader recovery structure off the double-bottom.
RSI at 62.48 confirms the momentum behind the bounce but has just printed a bearish divergence into this high — a caution flag right at resistance.
A clean 1H close above 7,560 opens room back toward 7,600. Rejection here keeps the 100-SMA at 7,528 in play, with 7,500 the next downside marker.
Looking at trader positioning data provided by the positioning edge tool, and it shows extreme bearish divergence with profitable traders leaning net-short (43% long) while unprofitable traders favor longs (61% long), making winning traders 17% more short overall.
Are you currently holding any positions in ES, or are you looking to use this divergence data to plan your next specific entry?


