The Setup: Coiled Below Record-Region Resistance
The S&P 500 e-mini (ES) walked into Wednesday’s inflation print already pressed against the ceiling that has defined the past week. After tagging the record region and stalling at 7,789.25, the contract spent Tuesday’s oil-led risk-off session bleeding back toward its rising trendline, with the cash index closing at 7,728.20 (−0.32%) as crude’s Hormuz premium kept a bid under Treasury yields.
What the CPI Print Actually Did
July CPI landed almost exactly on the screws.
Headline inflation cooled to 3.4% year-on-year (from 3.5%), rising 0.1% on the month, while core held at 0.2% month-on-month and eased to 2.5% year-on-year. In-line and unthreatening, enough to let futures traders lean back toward a September hold, with the odds of a quarter-point hike drifting to roughly 44% from a near coin-flip the day before.
ES took the cue, ticking up around 0.4% and reclaiming the 100-hour line to retest 7,789.25 within twenty minutes of the release.
But the all-clear is conditional. Three FOMC officials already dissented in favour of a hike at the July meeting, and the variable has not gone away: with Brent still pinned near $89 and the 10-year holding around 4.7%, the same oil-inflation channel that has powered the Fed’s hawkish tail all summer remains armed.
In short, In-line inflation removed the market’s excuse to sell, but with crude near $89 and the 10-year at 4.7%, oil, not the CPI line, keeps a hand on the brake.
On the rate hike front, Cleveland Federal Reserve President Beth Hammack signaled that further interest rate hikes may be necessary to tame persistent inflation.
In an interview with Yahoo Finance ahead of the CPI print, Hammack noted that current benchmark rates are not "meaningfully restricting" the economy, emphasizing that businesses she speaks with are not "sensing any restraint from investments in growth based on where interest rates are". Following her dissent at the Fed's recent policy meeting, Hammack argued that a single 25-basis-point move would likely do little for the broader economy, indicating that multiple rate hikes could be required to lower inflation to the Fed's 2% target. She warned that the longer the central bank waits to act, the harder and more costly it will ultimately be to restore price stability.
The Technical Picture - S&P 500 (ES)
The 1-hour chart looks encouraging for buyers, but the market hasn't made a decisive move yet.
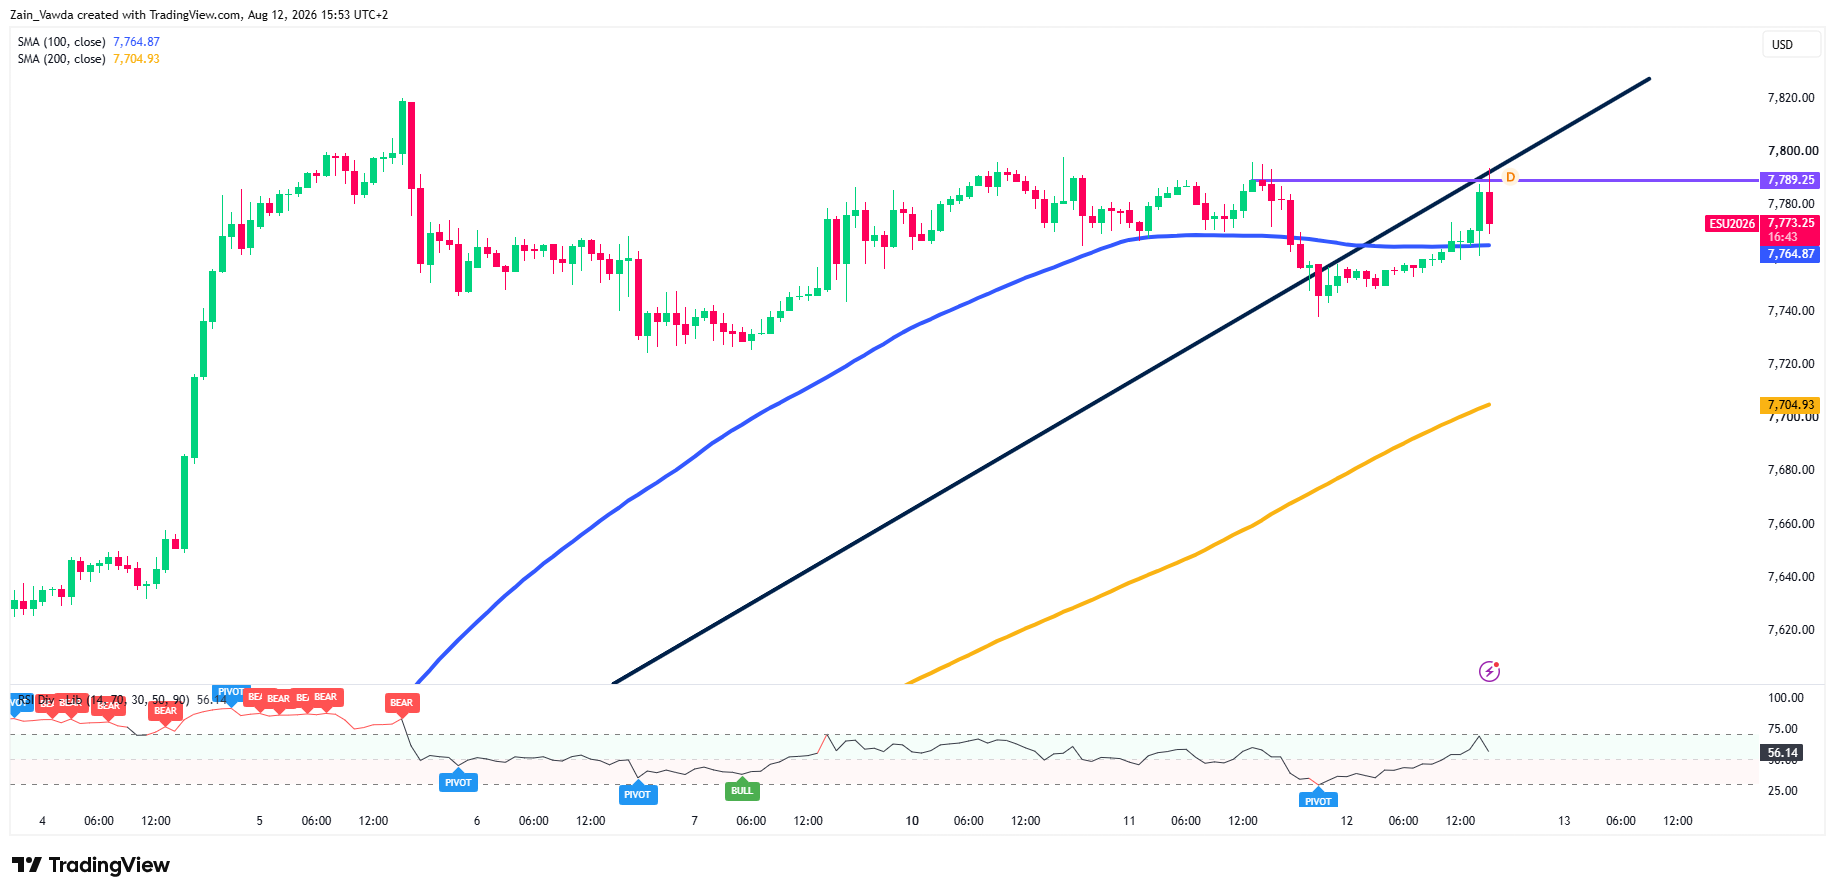
S&P 500 (ES) One-Hour Chart, August 12, 2026
Source: TradingView
The price sits around 7,783.00, holding comfortably above two key support levels,the 100-period moving average at 7,764.77 and the 200-period at 7,703.43.
The concern though is a brief drop before the CPI report breached the ascending trendline. However price has since rallied with a retest of the trendline, with the question now being whether this was a fake-out.
The fact that buying momentum is picking up with the RSI indicator climbing to 67.59, suggest that this could very well be a fake-out.
The key price level to watch is 7,789.25:
- If it breaks above: An hourly close above 7,789.25 could push the price toward 7,800 and eventually the primary target of 8,000.
- If it gets rejected: The price will fall back to test support at the 100-period moving average (7,764.77) to see if buyers can maintain the upward trend.
Scenario Matrix — The 7,789 Test Into Thursday’s PPI
| Scenario | ES PATH — keyed to the 7,789.25 test and Thursday’s July PPI |
|---|---|
| Bull | An hourly close above 7,789.25 confirms the breakout — 7,800 psychological, then the desk’s 8,000 objective. A benign PPI validates the September-hold lean and lets RSI drive through 70 without the early-August divergence re-forming. |
| Base | Rejection at 7,789.25 with price holding the reclaimed 7,764.77 (100-SMA) — a 7,764–7,789 coil rather than a break. An in-line PPI keeps the range intact; grind, not resolution, into Friday’s retail sales. |
| Bear | Loss of 7,764.77 and the ~7,750 trendline opens a rotation to 7,703.43 (200-SMA). A hot PPI revives the September-hike tail — yields and crude squeeze multiples and the record region becomes a confirmed lower high. |
Retail Trader Sentiment
According to the latest data from the MarketFramework Positioning Edge Tool, it shows successful traders are selling. Only 36% of profitable traders are betting the market will go up, compared to 45% of losing traders making top traders 10% more short.
The tool marks this as a "Strong Bearish Divergence," suggesting smart traders expect a price drop or are hedging their risk. Traders can use this data to follow winning participants by locking in profits on long trades, looking for short positions, or waiting for a price drop before buying again.


