
The S&P 500 (ES) bulls received another boost today following a soft NFP print, as the index holds near its recent highs around 7,820.
The markets reaction to the NFP print was interesting, with an initial spike being wiped out ahead of the U.S. market open.
The question for traders now is whether the ascending trendline will continue to hold and whether or not the S&P 500 can make a run for the 8,000 handle. Adding weight to the chart setup, Fundstrat co-founder Tom Lee expects breakout momentum and earnings strength to push the benchmark index toward the 7,900–8,000 zone before month's end.
Meanwhile, traders on the prediction market platform Kalshi price a roughly 66% to 73% chance that the S&P 500 will hit or exceed 8,000 at some point during 2026.
While reaching such heights might feel aggressive, a synthesis of technical chart structure, historical breakout statistics, and institutional forecasts suggests the path of least resistance remains upward.
Technical Analysis: Trendline and Moving Averages Hold the Fort
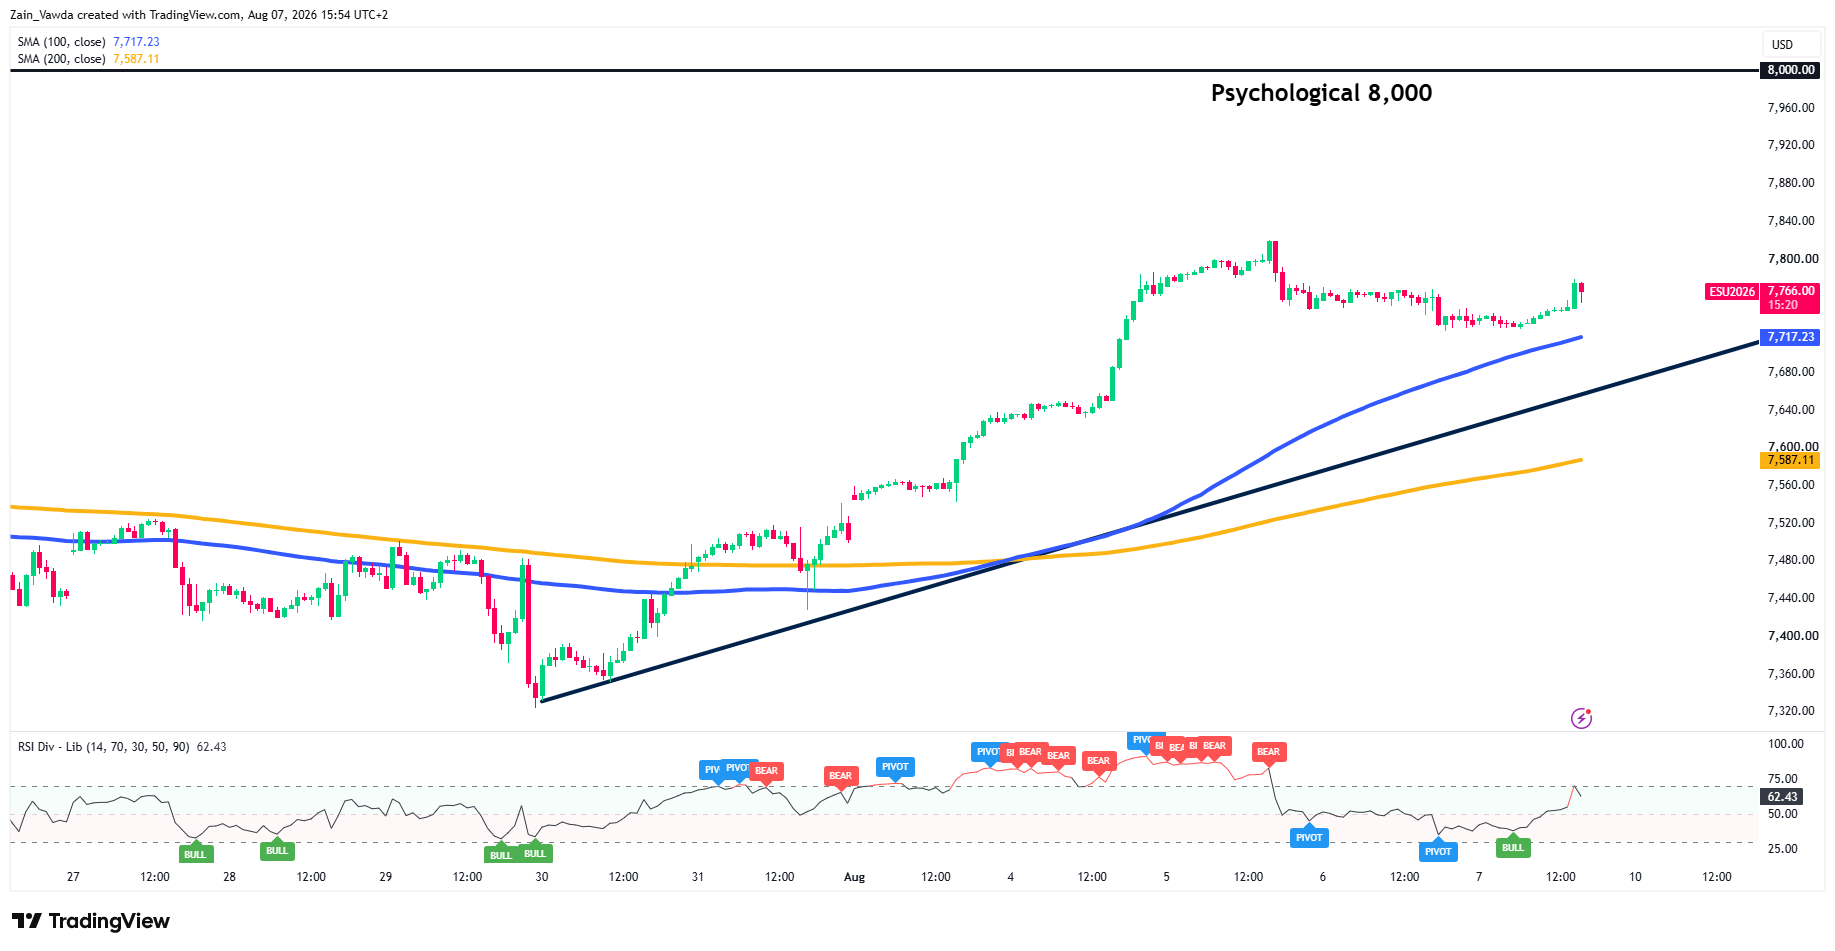
A close look at the hourly chart for ES highlights a textbook technical defense following the recent macroeconomic data release:
- Ascending Trendline Support: The primary trendline originating from the late-July swing low near 7,320 remains completely intact. Buyers aggressively defended this line during the recent dip.
- Key Moving Averages: The 100 SMA (blue) near 7,717 served as dynamic immediate support, while the 200 SMA (yellow) sits well below at 7,587, maintaining a healthy bullish alignment.
- RSI Momentum: The Relative Strength Index (RSI 14) has rebounded off recent pivot lows to sit around 57.25. This indicates that the market successfully digested brief overbought conditions without breaking market structure.
With buyers defending dynamic support around 7,700–7,720, the technical setup favors a retest of recent swing highs (~7,840) and a potential expansion toward 8,000.
S&P 500 (ES) One-Hour Chart, August 7, 2026
Source: TradingView
Historical Precedent: Breakouts Favor the Bulls
Market participants often hesitate to buy near all-time highs due to fear of "buying the top." However, historical data over the past decade (2016–2026) reveals that breakout momentum consistently outperforms an average trading day.
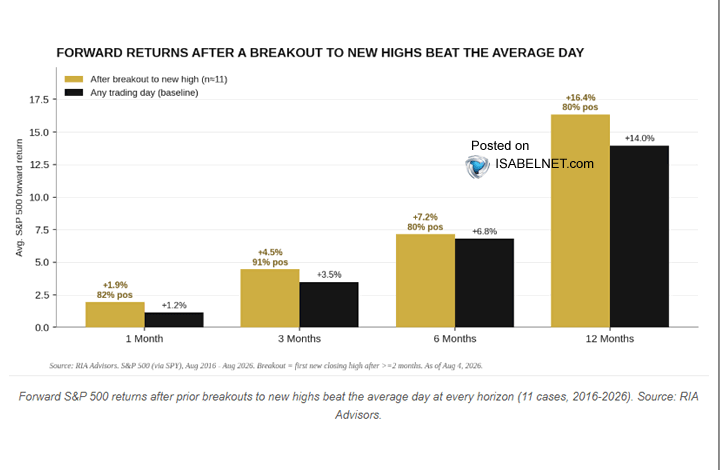
According to research from RIA Advisors, when the S&P 500 breaks to a new high after going at least two months without one, performance across all forward horizons significantly beats the baseline:
Source: Isabelnet, RIA Advisors
Three months after a breakout, the market has historically been higher 91% of the time, averaging a +4.5% gain. Across a 12-month window, average gains reach +16.4%. As the data notes, "Fear, in this case, has been a poor strategist."
Drawdown Context: Downside Volatility Appears Contained
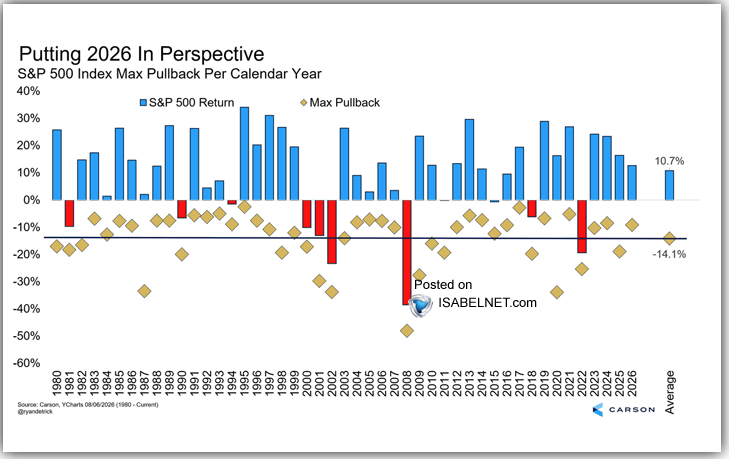
To further evaluate the likelihood of reaching 8,000, we must look at intra-year volatility context provided by Carson Investment Research:
- Historical Averages (1980–2026): The average calendar year sees a maximum intra-year pullback of -14.1%, while delivering an average annual return of +10.7%.
- 2026 Drawdown Context: March’s 9% pullback likely represents the deepest sell-off of 2026.
- Rarity of Secondary Sell-Offs: Historically, back-to-back drawdowns of 9%+ within the same calendar year are rare outside of severe economic recessions.
Because the market has already absorbed its typical mid-year pullback without damaging the broader structural trend, downside risks appear capped.
Source: Isabelnet, Carson Research
Conclusion: Is 8,000 Within Reach?
When you combine clean technical trendline support, a 91% historical win rate post-breakout over 3 months, and bullish institutional targets from Fundstrat’s Tom Lee, the narrative strongly favors continued upside.
While short-term pullbacks around economic data releases are always expected, the broader macro and technical backdrop suggests that a push toward 8,000 for S&P 500 futures is far more than wishful thinking—it is a statistically and fundamentally supported target.


