The S&P 500 closed at a record 7,737 on Tuesday, surpassing the peak it set back in early June and marking its first new high in two months. The Dow cleared 54,000 for the first time ever. On paper, it's the kind of session that ends any debate about whether the summer sell-off was a real crack or just a scare.
Underneath the headline number, that gap between price action and market health is the real story.
"Good, Not Great”
Piper Sandler's Chief Market Technician, Craig Johnson, put a name to the tension in a note this week. His view: falling oil prices, easing yields, and broadening participation near all-time highs point to a favorable risk-on setup. But persistent headline risks and soft market breadth mean the recovery qualifies as good, not great.
The composition of Tuesday's rally reinforces the point. Gains were led by Caterpillar, Cisco, and IBM, belonging to the industrials and legacy tech spaces, not the artificial intelligence (AI) names that dominated the summer's volatility. A record close driven by rotation into "boring" cyclicals is a different animal than one driven by broad-based buying across sectors.
That said, LPL Financial Chief Technical Strategist Adam Turnquist notes that the S&P 500 has largely been confined to a 5% trading range since June 1. This is despite the markets having contended with recurring U.S.-Iran tensions, higher interest rates and oil prices, shifting expectations for monetary policy, new tariff announcements, and Kevin Warsh’s first Federal Open Market Committee (FOMC) meeting.
Reading the Charts
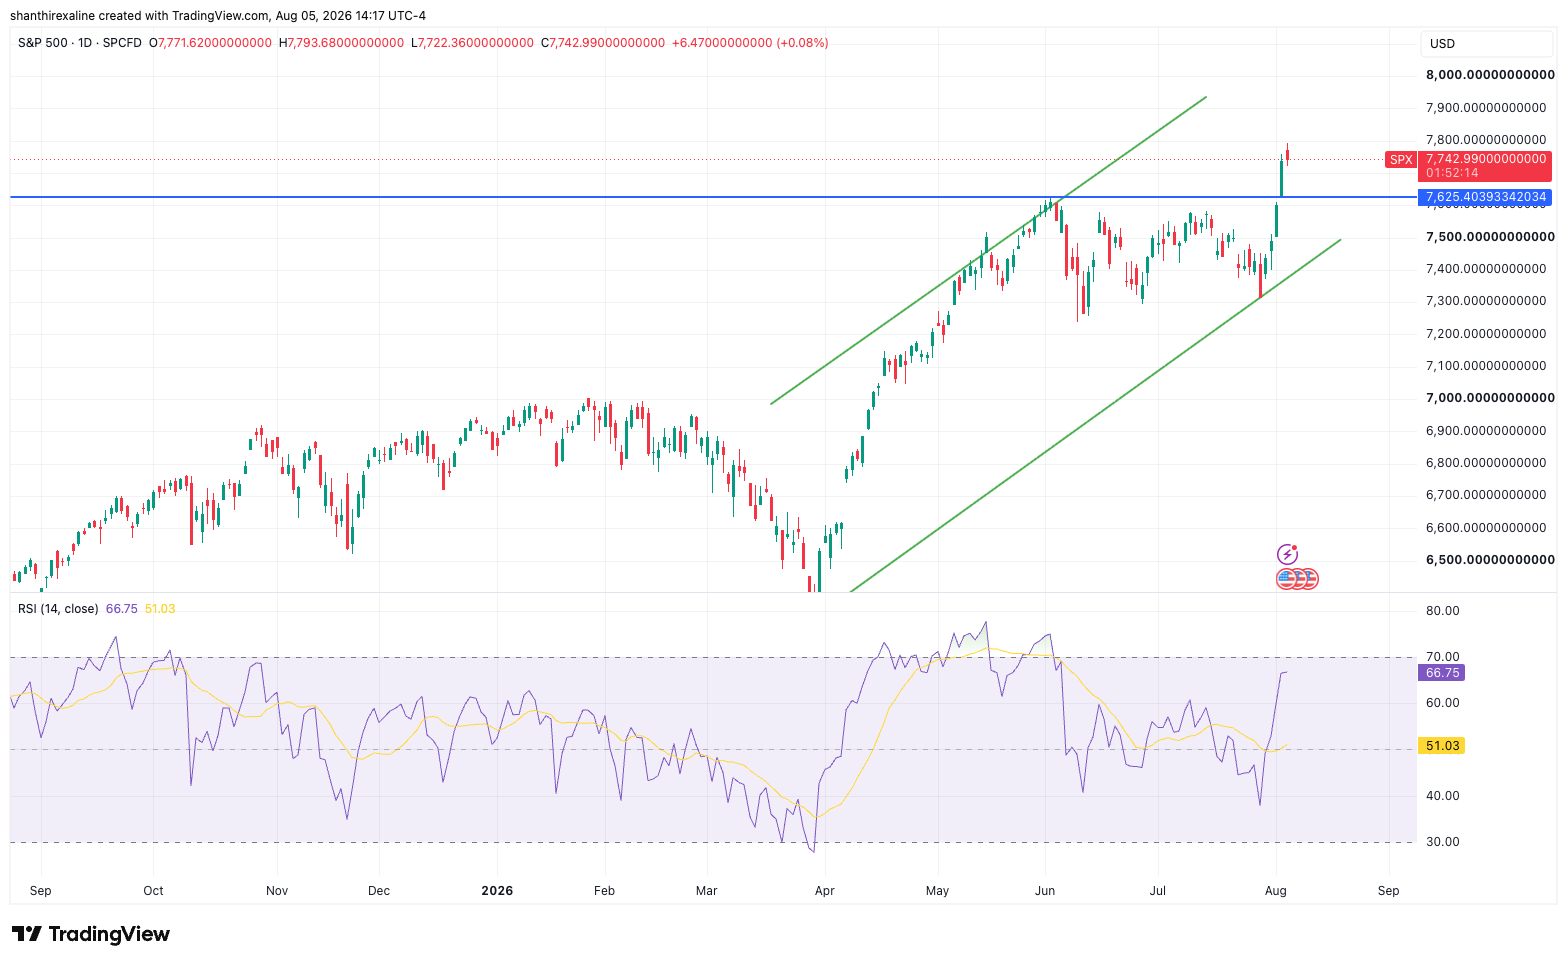
The daily chart tells a more constructive story than the breadth debate alone suggests — though it comes with its own line in the sand. The S&P spent June and July chopping sideways in a roughly 7,300-to-7,625 range, the exact "5% trading range" Turnquist flagged. Tuesday's session broke that range decisively, gapping straight through the 7,625 ceiling to close near 7,743. That old resistance level is now the first line of support to watch on any pullback.
Momentum backs up the move rather than undercutting it. The 14-day RSI sits at 66.75, climbing in tandem with price rather than lagging behind it — there's no negative divergence here, which is a genuinely bullish signal for a breakout. The one flag: RSI is closing in on the overbought 70 threshold, the same zone it hit at the May peak right before the market rolled into its multi-month range. The move also remains inside the broader ascending channel that's been in place since the April low, with room toward the upper trendline — roughly the 7,900–8,000 area — before the channel itself would start to call the advance overextended.
Source: TradingView
Put simply: the chart says this breakout has real momentum behind it, not a thinning one. The test is whether the S&P can hold above 7,625 on any retest — a clean hold confirms the range-break and supports the "good, not great, but real" thesis; a fast slip back inside the old range would suggest Tuesday's gap was more of a squeeze than a breakout.
Why the Base May Be Healthier This Time
There's a genuine bull case for why this record is more durable than it looks. Bloomberg has reported that the chip-stock selloff of the past two months aggressively flushed out excess froth from the market, and data from prime brokers — the firms that finance hedge funds — shows leverage has largely been cleaned up. In plain terms: some of the speculative excess that made the market fragile in June is gone. A rally built on a reset base, even a narrow one, has a better chance of holding than one built on unwound leverage.
That's the counterweight to the breadth concern — the market may be thinner right now, but it's also less brittle.
The Seasonality and Fed Risk Ahead
Two overhangs complicate the "good, not great" thesis further. First, seasonality: Bank of America data shows August through October is historically the S&P 500's weakest three-month stretch of the year, which puts a record high at the start of that window in an awkward spot.
Second, monetary policy: markets are navigating the start of Kevin Warsh's tenure as Federal Reserve chair at the same time stubborn inflation has investors pricing in the possibility the Fed holds rates steady — or even hikes — in the months ahead. A new Fed chair and a not-yet-solved inflation problem is a combination markets haven't had to price before this cycle.
The Concentration Question
The breadth problem may ultimately be an AI-concentration problem wearing a different label. Extraordinary single-day volatility in South Korea this summer underscored how exposed global markets have become to one dominant theme. If the S&P's gains are still substantially a function of how a small handful of AI-linked mega-caps trade, then "weak breadth" isn't a side issue — it's the central vulnerability, record high or not.
What Breadth Needs to Do From Here
The bull case and the caution case aren't mutually exclusive. If more sectors and a wider share of individual stocks start confirming new highs alongside the S&P, "good, not great" becomes simply good. If the rally keeps riding on a narrow group of leaders while the index grinds higher, the record close becomes a number to be skeptical of rather than one to celebrate.
Positioning Edge data show a slight bearish edge among the traders who have been getting the market right. Profitable traders are currently 45% long (55% short), while unprofitable traders are 50% long, meaning the profitable cohort is about 5% more short than the losing cohort. The signal is not aggressively bearish, but it suggests experienced traders remain somewhat cautious despite the recent rally.
At the same time, overall positioning is fairly balanced rather than extreme. With neither side showing overwhelming conviction, the data point more toward a market consolidating gains than one poised for a major reversal. For ES futures, a sustained move higher would likely require profitable traders to shift back toward the long side, while a further increase in short exposure could signal growing skepticism toward the breakout.


