
U.S. equity futures walked into Thursday carrying two opposing forces.
On one side, a second night of U.S. strikes on Iran, retaliatory missile fire on Gulf bases, and a Dow that shed more than 500 points on Wednesday while the Stoxx 600 logged its worst session since March.
On the other, a Q2 earnings season that kicks off in earnest next week, with consensus expecting S&P 500 profit growth of roughly 24.4% year-on-year, per LSEG.
The preannouncements and the earnings reports that begin to trickle in will answer a simple question for S&P traders: is an earnings engine running that hot strong enough to act as a circuit breaker against a war-premium VIX?
The Setup: Divergence Under the Surface
Wednesday's session was a rotation story more than a risk-off story.
The Dow fell roughly 1% while the Nasdaq actually closed green, and this morning the Nasdaq 100 Index (NDX) is leading again, up more than 1.30%, powered by a global chip rally into SK Hynix's oversubscribed Friday listing.
VIX, meanwhile, has firmed toward 17: elevated versus June's calm, but hardly panic pricing given missiles are flying over the Gulf. That gap, geopolitical headlines screaming, volatility merely simmering is precisely the space earnings will fill. Strong prints validate the market's composure; misses expose it.
The Three-Stage Stress Test
Stage one — PepsiCo: a pass, with caveats. The season's opening print landed Thursday morning and came in mixed. Revenue beat at $24.18 billion, up 6.4% year-on-year against consensus near $23.96 billion, with organic growth of 2.4% but core EPS of $2.20 was a cent shy of the $2.21 Street estimate.
The composition told the real story: strong international demand for snacks and beverages, plus growth in zero-sugar and prebiotic lines, offset softness across the North American food and drink divisions as inflation-squeezed US consumers pulled back. Management reiterated the full-year guidance of 2–4% organic growth and 4–6% core constant-currency EPS growth, and the stock initially traded around 1% higher.
Vital Knowledge's desk summed up the tension, calling it “mostly an inline/boring report, although the details skew net negative”, margins fell year-on-year, and it is exactly that margin erosion in a 4.2% CPI world that the rest of the earnings tape will be judged against.
Stage two — Delta, Friday July 10. This is the purest oil-shock earnings test on the calendar. US airlines' collective fuel bill topped $6 billion in May alone, up 84% from a year earlier. Delta's guidance is effectively a live mark-to-market of what $74 WTI does to a fuel-intensive income statement — and a template for how analysts will haircut every energy-exposed sector in the index.
Stage three — the banks plus CPI, Tuesday July 14. JPMorgan, Bank of America, Goldman Sachs, Wells Fargo and Citigroup all report the same morning June CPI lands. A hot inflation print alongside cautious bank credit commentary is the single most dangerous combination on the calendar for ES longs; a cool print plus clean net interest income guidance is the bull unlock.
What the Charts Say
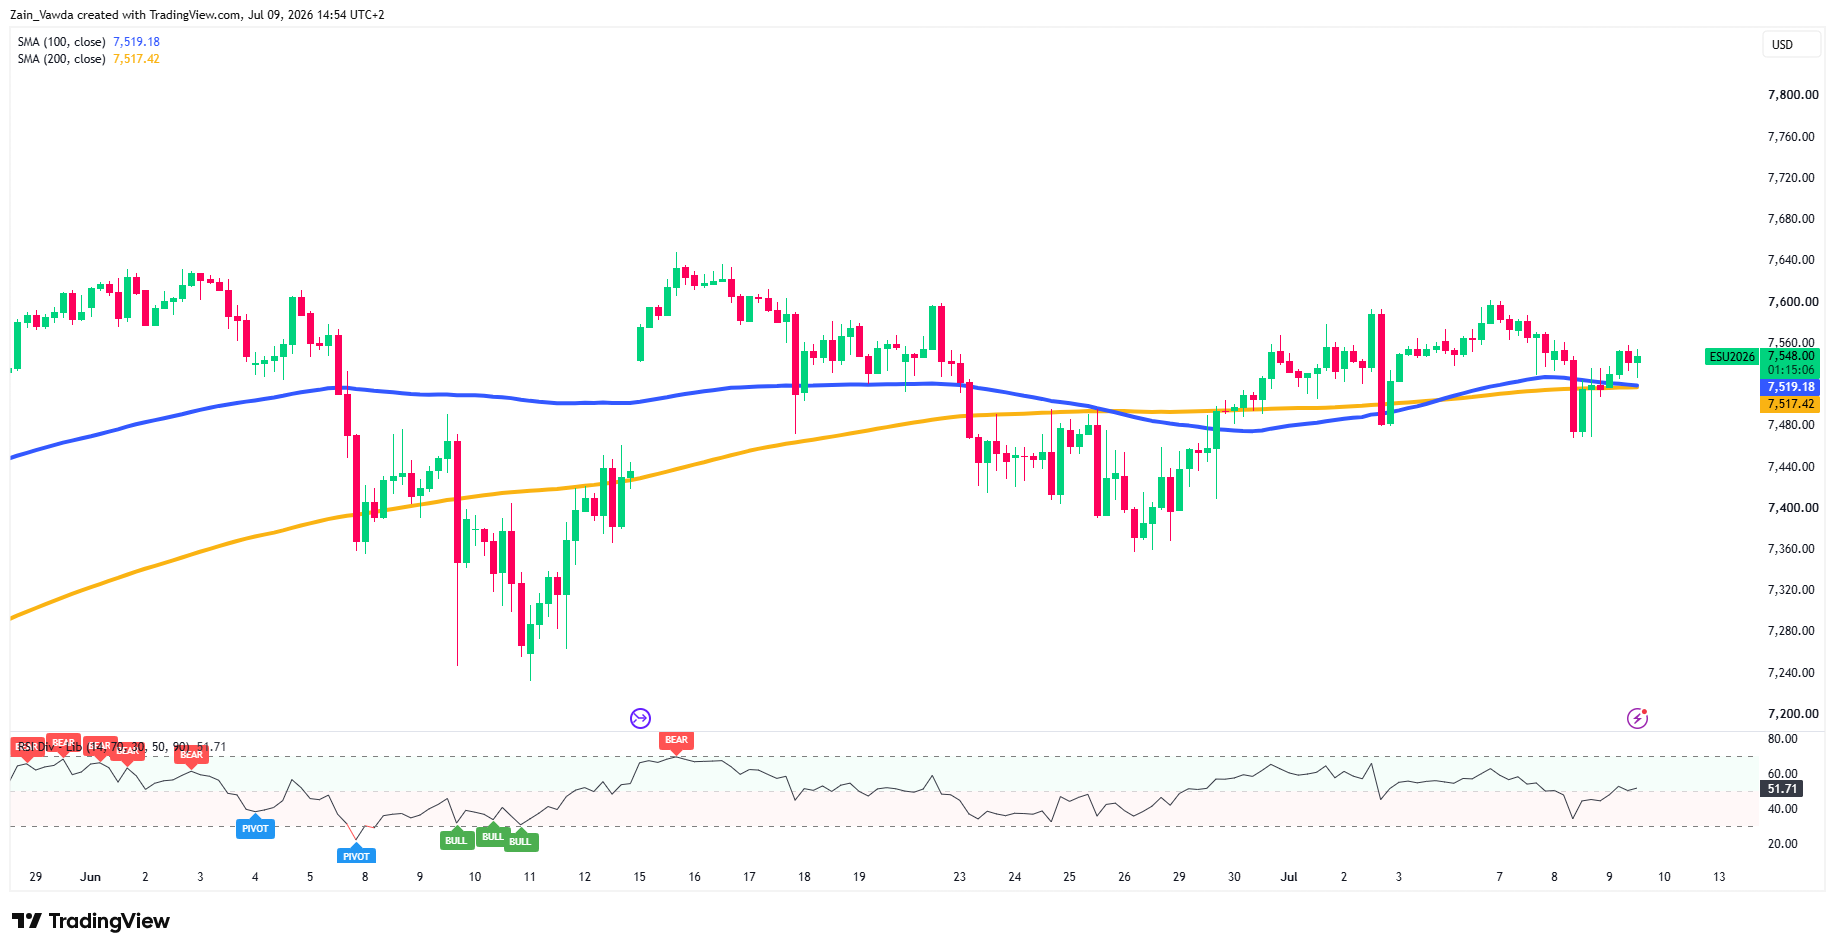
S&P 500 Futures (ES) Four-Hour Chart, July 9, 2026
Source: TradingView
S&P 500 (ES) is holding above the now-converged 100-day (7,519) and 200-day (7,517) MAs, a tight cluster that has become the key battleground after Wednesday's sharp rejection wick down to 7,467.
Price at 7,548 has reclaimed both averages, keeping the broader range structure intact, though rallies continue to fade below the 7,600–7,640 resistance zone that capped June and early-July advances.
RSI at 52 is neutral, reflecting balanced momentum. A sustained hold above 7,517–7,519 keeps buyers in control targeting 7,600, while a decisive close below the cluster would expose 7,480 and then 7,400.
Profitable ES traders just flipped net long. See who's positioned where with the Trade Validator
The Historical Backstop: Drawdowns Are the Price of Admission
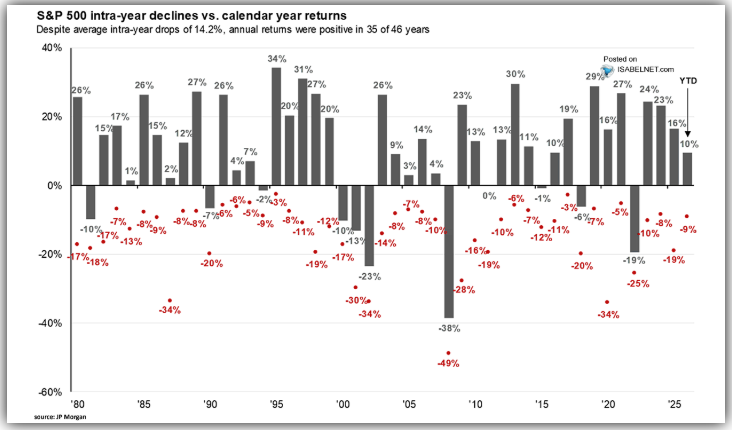
For traders tempted to read every war-driven dip as the start of something terminal, the long-run data offers useful perspective. J.P. Morgan Asset Management's well-known intra-year declines study shows the S&P 500 suffers an average peak-to-trough drawdown of roughly 14% every single year, yet the index has still finished the calendar year in positive territory in 35 of the past 46 years.
Source: Isabelnet, J.P. Morgan
In other words, double-digit intra-year pain is the historical norm, not the exception, and it has coexisted with positive annual returns roughly three years out of four.
Applied to the current tape: a war-premium pullback of the kind Wednesday's Dow flush hinted at sits comfortably inside a normal year's distribution and with earnings growth running north of 20%, the fundamental engine behind those historically resilient calendar-year outcomes is unusually strong. The asymmetry to respect is the one the data cannot show: the average conceals the tails, and a genuine Hormuz closure would be a tail. Structure, not conviction, is what carries a futures account through a 14% index drawdown.


